Introduction
Welcome to the Alumet user guide! If you want to measure something with Alumet, you have come to the right place.
To skip the introduction and install Alumet, click here.
What is Alumet?
Alumet is a modular framework for local and distributed measurement.

Alumet provides a unified interface for gathering measurements with sources (on the left), transforming the data with models (in the middle) and writing the result to various outputs (on the right). The elements (colored rectangles) are created by plugins, on top of a standard framework.
Key points:
- The framework is generic and extensible: you can write your own plugins if you need to, or take what you need among the numerous existing plugins. Alumet can easily be extended in order to make new research experiments: add new probes, statistical models, transform functions, export formats, etc. using a high-level API.
- Alumet is efficient: written in Rust and optimized for low-latency measurement. (scientific publication pending with benchmarks)
- Alumet is more correct than some existing “software powermeters”: our plugins fix some bugs that are hard to detect1.
- It produces good operational tools: the end result is (or aims to be) a ready-to-use measurement tool that is robust, efficient and scalable.
- You have control over the tool: the methodology is transparent, the configuration is clear, and you are free to change whatever you want.
Please read the developer book to learn more about the creation of plugins.
What makes Alumet more efficient?
The L in Alumet stands for Lightweight. Why is Alumet “lightweight” compared to other measurement tools?
- Optimized pipeline: Alumet is written in Rust, optimized for minimal latency and low memory consumption.
- Efficient interfaces: When we develop a new measurement source, we try to find the most efficient way of measuring what we’re interested in. As a result, many plugins are based on low-level interfaces, such as the Linux perf_events interface, instead of slower higher-level wrappers. In particular, we try to remove useless intermediate levels, such as calling an external program and parsing its text output.
- Pay only for what you need: Alumet’s modularity allows you to create a bespoke measurement tool by choosing the plugins that suit your needs, and removing the rest. You don’t need a mathematical model that assigns the energy consumption of hardware components to processes? Remove it, and enjoy an even smaller disk footprint, CPU overhead, memory use and energy consumption.
Does it work on my machine ?
For now, Alumet works in the following environments:
- Operating Systems: Linux,
macOS2, Windows2 - Hardware components3:
- CPUs: Intel x86 processors (Sandy Bridge or more recent), AMD x86 processors (Zen 1 or more recent), NVIDIA Jetson CPUs (any model)
- GPUs: NVIDIA dedicated GPUs, NVIDIA Jetson GPUs (any model)
(nice compatibility table coming soon)
-
Guillaume Raffin, Denis Trystram. Dissecting the software-based measurement of CPU energy consumption: a comparative analysis. 2024. ⟨hal-04420527v2⟩. ↩
-
While the core of Alumet is cross-platform, many plugins only work on Linux, for example the RAPL and perf plugins. There is no macOS-specific nor Windows-specific plugin for the moment, so Alumet will not be able to measure interesting metrics on these systems. ↩ ↩2
-
If your computer contains both supported and unsupported components, you can still use Alumet (with the plugins corresponding to the supported components). It will simply not measure the unsupported components. ↩
The main parts of Alumet: core, plugins, agents
One of the key features of the Alumet framework is its extensibility. Thanks to a clear separation between the “core” and the “plugins”, Alumet allows to build measure-made measurement tools for a wide range of situations.
This page offers a simple, high-level view of the main concepts. For a more detailed explanation, read the Alumet Architecture chapter of the Alumet Developer Book.
Alumet core
The core of Alumet is a Rust library that implements:
- a generic and “universal” measurement model
- a concurrent measurement pipeline based on asynchronous tasks
- a plugin system to populate the pipeline with various elements
- a resilient way to handle errors
- and various utilities
Alumet plugins
On top of this library, we build plugins, which use the core to provide environment-specific features such as:
- gathering measurements from the operating system
- reading data from hardware probes
- applying a statistical model on the data
- filtering the data
- writing the measurements to a file or database
- …
Alumet agent(s)
But Alumet core and Alumet plugins are not executable! You cannot run them to obtain your measurements. To get an operational tool, we combine them in an agent: a runnable application.
We provide a “standard” agent that you can download and use right away. See Installing Alumet. You can also build your own customized agent, it only takes a few lines of codes. Refer to the Developer Book.
Installing Alumet agent
⚠️ Alumet is currently in Beta.
If you have trouble using Alumet, do not hesitate to discuss with us, we will help you find a solution. If you think that you have found a bug, please open an issue in the repository.
There are three main ways to install the standard Alumet agent1:
- 🌐 Download using our install script. This is the simplest method.
- 📦 Download a pre-built package.
- 🐳 Pull a docker image.
- 🔵 Deploy in a K8S cluster with a helm chart.
- 🧑💻 Use
cargoto compile and install Alumet from source. This requires a Rust toolchain, but enables the use of the most recent version of the code without waiting for a new release.
Option 1: Installing with the install script
You can use the following install script to get the latest version released:
curl -sSfL https://github.com/alumet-dev/alumet/raw/refs/heads/main/install.sh | sh
Or if you want a specific version of Alumet (for example here v0.9.2):
curl -sSfL https://github.com/alumet-dev/alumet/raw/refs/heads/main/install.sh | sh -s -- -r v0.9.2
Option 2: Installing with a pre-built package
Go to the latest release on Alumet’s GitHub page.
In the Assets section, find the package that corresponds to your system.
For instance, if you run Ubuntu 22.04 on a 64-bits x86 CPU, download the file that ends with amd64_ubuntu_22.04.deb.
You can then install the package with your package manager. For instance, on Ubuntu:
sudo apt install ./alumet-agent*amd64_ubuntu_22.04.deb
We currently have packages for multiples versions of Debian, Ubuntu, RHEL and Fedora. We intend to provide even more packages in the future.
What if I have a more recent OS?
The packages that contain the Alumet agent have very few dependencies, therefore an older package should work fine on a newer system. For example, if you have Ubuntu 25.04, it’s fine to download and install the package for Ubuntu 24.04.
To simplify maintenance, we don’t release one package for each OS version, but we focus on LTS ones.
My OS is not supported, what do I do?
Alumet should work fine on nearly all Linux distributions, but we do not provide packages for every single one of them. Use another installation method (see below). For instance, if you are using Ubuntu on ARM devices (for example Jetson edge devices), you should compile the agent from source.
Alumet core is OS-agnostic, but the standard Alumet agent does not support Windows nor macOS yet1.
Option 3: Installing with Podman/Docker
Every release is published to the container registry of the alumet-dev organization.
Pull the latest image with the following command (replace podman with docker if you use docker):
podman pull ghcr.io/alumet-dev/alumet-agent
View more variants of the container image on the alumet-agent image page.
Privileges required when running
Because Alumet has low-level interactions with the system, it requires some privileges. The packages take care of this setup, but with a container image, you need to grant these capabilities manually.
To run alumet-agent, you need to execute (again, replace podman with docker if you use docker):
podman run --cap-add=CAP_PERFMON,CAP_SYS_NICE ghcr.io/alumet-dev/alumet-agent
Launcher script (optional)
Let’s simplify your work and make a shortcut: create a file alumet-agent somewhere.
We recommend $HOME/.local/bin/ (make sure that it is in your path).
#!/usr/bin/bash
podman run --cap-add=CAP_PERFMON,CAP_SYS_NICE ghcr.io/alumet-dev/alumet-agent
Give it the permission to execute with chmod +x $HOME/.local/bin/alumet-agent, and voilà!
You should now be able to run the alumet-agent command directly.
Option 4: Installing in a K8S cluster with Helm
To deploy Alumet in a Kubernetes cluster, you can use our Helm chart to setup a database, an Alumet relay server, and multiple Alumet clients. Please refer to Distributed deployment with the relay mode for more information.
Quick install steps:
helm repo add alumet https://alumet-dev.github.io/helm-charts
helm install alumet-distributed alumet/alumet
Here, alumet-distributed is the name of your Helm release, you can put the name you want, or use --generate-name to obtain a new, unique name.
See the Helm documentation.
Option 5: Installing from source
Prerequisite: you need to install the Rust toolchain.
Use cargo to compile the Alumet agent.
cargo install --git https://github.com/alumet-dev/alumet.git alumet-agent
It will be installed in the ~/.cargo/bin directory.
Make sure to add it to your PATH.
To debug Alumet more easily, compile the agent in debug mode by adding the --debug flag (performance will decrease and memory usage will increase).
For more information on how to help us with this ambitious project, refer to the Alumet Developer Book.
Privileges required
Because Alumet has low-level interactions with the system, it requires some privileges. The packages take care of this setup, but with a container image, you need to grant these capabilities manually.
The easiest way to do is is to use setcap as root before running Alumet:
sudo setcap 'cap_perfmon=ep cap_sys_nice=ep' ~/.cargo/bin/alumet-agent
This grants the capabilities to the binary file ~/.cargo/bin/alumet-agent.
You will then be able to run the agent directly.
Alternatively, you can also run the Alumet agent without doing setcap, and it will tell you what to do, depending on the plugins that you have enabled.
NOTE: running Alumet as root also works, but is not recommended. A good practice regarding security is to grant the least amount of privileges required.
Post-install steps
Once the Alumet agent is installed, head over to Running Alumet.
Running Alumet agent
To start using the Alumet agent, let us run it in a Terminal.
First, run alumet-agent --help to see the available commands and options.
There are two commands that allow to measure things with Alumet. They correspond to two measurement “modes”:
- The
runmode monitors the system. - The
execmode spawns a process and observes it.
Monitoring the system with the run mode
In run mode, the Alumet agent uses its plugins to monitor the entire system (to the extent of what the plugins do).
To choose the plugins to run, pass the --plugins flag before the run command (this is because the list of plugins apply to every command of the agent, it’s not specific to run).
Example:
alumet-agent --plugins procfs,csv run
This will start the agent with two plugins:
procfs, which collects information about the processescsv, which stores the measurements in a local CSV file
Stopping
To stop the agent, simply press Ctrl+C.
CSV file
The default CSV file is alumet-output.csv.
To change the path of the file, use the --output-file option.
alumet-agent --plugins procfs,csv --output-file "measurements-experiment-1.csv" run
Unlike some other measurement tools, Alumet saves measurements periodically, and provides the full data (unless you use plugins to aggregate or filter the measurements that you want to save, of course).
Default command
Since run is the default command, it can be omitted.
That is, the above example is equivalent to:
alumet-agent --plugins procfs,csv
Observing a process with the exec mode
In exec mode, the Alumet agent spawns a single process and uses its plugins to observe it.
The plugins are informed that they must concentrate on the spawned process instead of monitoring the whole system.
For instance, the procfs plugin will mainly gather measurements related to the spawned process. It will also obtain some system measurements, but will not monitor all the processes of the system.
Example:
alumet-agent --plugins procfs,csv exec sleep 5
Everything after exec is part of the process to spawn, here sleep 5, which will do nothing for 5 seconds.
When the process exits, the Alumet agent stops automatically.
One just before, one just after
To guarantee that you obtain interesting measurements even if the process is short-lived, some plugins (especially the ones that measure the energy consumption of the hardware) will perform one measurement just before the process is started and one measurement just after it terminates.
Of course, if the process lives long enough, the measurement sources will produce intermediate data points on top of those two “mandatory” measurements.
Understanding the measurements: how to read the CSV file
The CSV file produced by this simple setup of Alumet looks like this. The output has been aligned and spaced to make it easier to understand, scroll on the right to see it all.
metric                 ; timestamp                     ; value      ; resource_kind; resource_id; consumer_kind; consumer_id; __late_attributes
mem_total_kB           ; 2025-04-25T15:08:53.949565834Z; 16377356288; local_machine;            ; local_machine;            ;
mem_free_kB            ; 2025-04-25T15:08:53.949565834Z;   884572160; local_machine;            ; local_machine;            ;
mem_available_kB       ; 2025-04-25T15:08:53.949565834Z;  8152973312; local_machine;            ; local_machine;            ;

kernel_new_forks       ; 2025-04-25T15:08:53.949919481Z;           2; local_machine;            ; local_machine;            ;
kernel_n_procs_running ; 2025-04-25T15:08:53.949919481Z;           6; local_machine;            ; local_machine;            ;
kernel_n_procs_blocked ; 2025-04-25T15:08:53.949919481Z;           0; local_machine;            ; local_machine;            ;

process_cpu_time_ms    ; 2025-04-25T15:08:53.99636522Z ;           0; local_machine;            ; process      ;       65387; cpu_state=user
process_cpu_time_ms    ; 2025-04-25T15:08:53.99636522Z ;           0; local_machine;            ; process      ;       65387; cpu_state=system
process_cpu_time_ms    ; 2025-04-25T15:08:53.99636522Z ;           0; local_machine;            ; process      ;       65387; cpu_state=guest
process_memory_kB      ; 2025-04-25T15:08:53.99636522Z ;        2196; local_machine;            ; process      ;       65387; memory_kind=resident
process_memory_kB      ; 2025-04-25T15:08:53.99636522Z ;        2196; local_machine;            ; process      ;       65387; memory_kind=shared
process_memory_kB      ; 2025-04-25T15:08:53.99636522Z ;       17372; local_machine;            ; process      ;       65387; memory_kind=vmsize
The first line contains the name of the columns. Here is what they mean.
metric: the unique name of the metric that has been measured. With the default configuration of thecsvplugin, the unit of the metric is appended to its name in the CSV (see Common plugin options). For instance,process_cpu_timeis in milliseconds. Some metrics, such askernel_n_procs_running, have no unit, they’re numbers without a dimension.timestamp: when the measurement has been obtained. Timestamps are serialized as RFC 3339 date+time values with nanosecond resolution, in the UTC timezone (hence theZat the end).value: the value of the measurement. For instance,kernel_n_procs_runninghas a value of6at2025-04-25T15:08:53.949919481.resource_kindandresource_idindicate the “resource” that this measurement is about. It’s usually a piece of hardware. The special datalocal_machine(with an empty value for the resource id) means that this measurement is about the entire system. If a CPU-related plugin was enabled, it would have produced measurements with a resource kind ofcpu_packageand a resource id corresponding to that package.consumer_kindandconsumer_idindicate the “consumer” that this measurement is about: who consumed the resource? It’s usually a piece of software. For instance,local_machinemeans that there was no consumer, the measurement is a global system-level measurement such as the total amount of memory or the temperature of a component.process;1(kindprocess, id65387) means that this measurement concerns the consumption of the process with pid65387.
Additional attributes in the CSV output
Alumet measurements can contain an arbitrary number of additional key-value pairs, called attributes.
If they are known early, they will show up as separate CSV columns.
However, it’s not always the case. If an attribute appears after the CSV header has been written, it will end up in the __late_attributes column.
Attributes in __late_attributes should be treated just like attributes in separate CSV columns.
In the output example, measurements with the process_cpu_time metric have an additional attribute named cpu_state, with a string value.
It refines the perimeter of the measurement by indicating which type of CPU time the measurement is about.
In particular, Linux has separate counters for the time spent by the CPU for a particular process in user code or in kernel code.
Configuration file
Alumet and its plugins can be configured by modifying a TOML file. If you don’t know TOML, it’s a configuration format that aims to be “a config file for humans”, easy to read and to modify.
For now, this User Book documents the last release of Alumet.
To get the documentation of a previous release, go to the GitHub repository, select the tag that corresponds to the version of Alumet, and navigate the folders to open the README.md of a plugin.
Where is the configuration file?
Packaged Alumet agent
Pre-built Alumet packages contain a default configuration file that applies to every Alumet agent on the system.
It is located at /etc/alumet/alumet-config.toml.
Standalone binary or Docker image
Installing the Alumet agent with cargo or using one of our Docker images (see Installing Alumet) does not set up a default global configuration file.
Instead, the agent automatically generates a local configuration file alumet-config.toml, in its working directory, on startup.
The content of the configuration depends on the plugins that you enable with the --plugins flag.
Overriding the configuration file 📄
You can override the configuration file in two ways:
- Pass the
--configargument. - Set the environment variable
ALUMET_CONFIG.
The flag takes precedence over the environment variable.
If you specify a path that does not exist, the Alumet agent will attempt to create it with a set of default values.
Example with the flag:
alumet-agent --plugins procfs,csv --config my-config.toml exec sleep 1
Example with the environment variable:
ALUMET_CONFIG='my-config.toml' alumet-agent --plugins procfs,csv exec sleep 1
Regenerating the configuration file 🔁
If the config file does not exist, it will be automatically generated.
But it is sometimes useful to manually generate the configuration file, for instance when you want to review or modify the configuration before using it. It is also useful when you change your environment in a way that is potentially incompatible with the current configuration, for example when updating the agent to the next major version.
The following command regenerates the configuration file:
alumet-agent config regen
It takes into account, among others, the list of plugins that must be enabled (specified by --plugins).
Disabled plugins will not be present in the generated config.
Common plugin options
Each plugin is free to declare its own configuration options. Nevertheless, some options are very common and can be found in multiple plugins.
Please refer to the documentation of each plugin for an accurate description of its possible configuration settings.
Source trigger options
Plugins that provide measurements sources often do so by delegating the trigger management to Alumet. In other words, it is Alumet (core) that wakes up the measurement sources when needed, and then the sources do what they need to do to gather the data.
In that case, the plugin will most likely provide the following settings:
poll_interval: the interval between each “wake up” of the plugin’s measurement source.flush_interval: how long to wait before sending the measurements to the next step in Alumet’s pipeline (if there is at least one transform in the pipeline, the next step is the transform step, otherwise it’s directly the output step).
These two settings are given as a string with a special syntax that represent a duration.
For example, the value "1s" means one second, and the value "1ms" means one millisecond.
Here is an example with the rapl plugin, which provide one measurement source:
[plugins.rapl]
# Interval between each measurement of the RAPL plugin.
# Most plugins that provide measurement sources also provide this configuration option.
poll_interval = "1s"

# Measurements are kept in a buffer and are only sent to the next step of the Alumet
# pipeline when the flush interval expires.
flush_interval = "5s"

# Another option (specific to the RAPL plugin, included for exhaustivity purposes)
no_perf_events = false
Note that the rapl plugin defines a specific option no_perf_events on top of the common configuration options for measurement sources.
Output formatting options
Plugins that provide outputs are often able to slightly modify the data before it is finally exported. Here are some options that are quite common among output plugins:
append_unit_to_metric_name(boolean): If set totrue, append the unit of the metric to its name.use_unit_display_name(boolean): If set totrue, use the human-readable display name of the metric unit when appending it to its name. If set tofalse, use the machine-readable ASCII name of the unit. This distinction is based on the Unified Code for Units of Measure, aka UCUM. This setting does nothing ifappend_unit_to_metric_nameisfalse.- Example: the human-readable display name of the “microsecond” unit is
µs, while its machine-readable unique name isus.
- Example: the human-readable display name of the “microsecond” unit is
Here is an example with the csv plugin, which exports measurements to a local CSV file.
[plugins.csv]
# csv-specific: path to the CSV file
output_path = "alumet-output.csv"

# csv-specific: always flush the buffer after each operation
# (this makes the data visible in the file with less delay)
force_flush = true

# Common options, described above
append_unit_to_metric_name = true
use_unit_display_name = true

# csv-specific: column delimited
csv_delimiter = ";"
Measurement Sources
Measurement sources produce new measurements by obtaining information.
With numerous sources, Alumet can easily run on a wide range of hardware devices and in multiple software environments. To get the measurements that you want, you should enable the relevant plugins. This section documents the plugins that provide new sources.
System-specific Requirements
In general, a plugin will only work if the corresponding hardware (such as a GPU) or software environment (such as K8S) is available. Most plugins that provide sources are only available on Linux operating systems.
Plugins are free to implement sources how they see fit. They can read low-level hardware registers, call a native library, read files, etc. Therefore, some plugins may require extra permissions or external dependencies.
Refer to the documentation of a particular plugin to learn more about its requirements.
AMD GPU plugin
Allows to measure AMD GPU hardware metrics with the ROCm software and amdsmi library.
The new plugin-amdgpu currently allows you to detect AMD architecture-based GPUs installed on a machine, and collect the following metrics on each of them.
Requirements
- Linux operating system.
- AMD GPU(s).
- Installation of
amd-smi-libpackage. - Set and configure some permissions on system to run properly all metrics: https://rocm.docs.amd.com/projects/install-on-linux/en/latest/install/prerequisites.html#configuring-permissions-for-gpu-access.
Metrics
Here are the metrics collected by the plugin source:
| Name | Type | Unit | Description | Resource | ResourceConsumer | Attributes |
|---|---|---|---|---|---|---|
amd_gpu_activity_usage | Gauge | percentage | GPU activity usage | GPU | LocalMachine | activity_type |
amd_gpu_energy_consumption | CounterDiff | milli-joule | Average between 2 measurement points based on the energy consumed since the last start-up | GPU | LocalMachine | |
amd_gpu_memory_usage | Gauge | megabyte | Video compute memory (VRAM) and graphics table translation memory (GTT) usage | GPU | LocalMachine | memory_type |
amd_gpu_power_consumption | Gauge | watt | Estimated average electricity consumption | GPU | LocalMachine | |
amd_gpu_temperature | Gauge | celsius | Values from AMD GPUs equipped with different sensors to precisely locate temperature by zone | GPU | LocalMachine | thermal_zone |
amd_gpu_voltage | Gauge | millivolt | Electric power consumption by a AMD GPU | GPU | LocalMachine | |
amd_gpu_process_compute_unit_occupancy | Gauge | percentage | Compute units used | process | pid | process_name |
amd_gpu_process_memory_usage | Gauge | byte | Process memory usage | process | pid | process_name |
amd_gpu_process_engine_usage_encode | Gauge | nanosecond | Process GFX engine usage | process | pid | process_name |
amd_gpu_process_engine_gfx | Gauge | nanosecond | Process encode engine usage | process | pid | process_name |
amd_gpu_process_memory_usage_cpu | Gauge | byte | Process CPU memory usage | process | pid | process_name |
amd_gpu_process_memory_usage_gtt | Gauge | byte | Process GTT memory usage | process | pid | process_name |
amd_gpu_process_memory_usage_vram | Gauge | byte | Process VRAM memory usage | process | pid | process_name |
Attributes
activity_type
The activity type defines the type of unit or component use by an AMD GPU :
| Value | Description |
|---|---|
graphic_core | Main graphic core of AMD GPU |
memory_management | Manage memory access and addresses translation |
unified_memory_controller | Memory controller managing access to VRAM in organising writing/reading operations |
memory_type
The memory type defines the type of consumed memory by an AMD GPU :
| Value | Description |
|---|---|
memory_graphic_translation_table | Buffer memory for system management used as interface between GPU and system memory |
memory_video_computing | GPU dedicated and integrated memory video to store graphics data for rendering |
thermal_zone
The architecture of AMD GPUs is broken down into several type zones associated with a thermal sensor, to analyse precisely the GPU hardware temperature :
| Value | Description |
|---|---|
thermal_global | The global temperature measured on a AMD GPU hardware |
thermal_hotspot | Value measured by a probe able to locating the maximal temperature on a AMD GPU hardware |
thermal_high_bandwidth_memory_X | Temperature measured on GPU equipped with High Bandwidth Memory, designed to deliver high data transfer while minimizing power consumption in same time. Each “X” index (0 to 3) corresponding to a specific HBM stack |
thermal_pci_bus | Temperature concerning only the data BUS PCI corresponding to the interface between GPU and others components |
process_name
| Value | Description |
|---|---|
process_name | ASCII table which defines the name in process parameters, converted in common UTF-8 encoded string |
Configuration
Here is a configuration example of the plugin. It’s part of the ALUMET configuration file (eg: alumet-config.toml).
[plugins.amd-gpu]
# Time between each activation of the counter source.
poll_interval = "1s"
# Initial interval between two flushing of AMD GPU measurements.
flush_interval = "5s"
# On startup, the plugin inspects the GPU devices and detect their features.
# If `skip_failed_devices = true`, inspection failures will be logged and the plugin will continue.
# If `skip_failed_devices = false`, the first failure will make the plugin's startup fail.
skip_failed_devices = true
More information
Due to the not truly thread safely behavior of the current amdsmi library, all GPUs are collected and polled by the same source.
Not all software use the GPU to its full extent.
For instance, to obtain non-zero values for the video encoding/decoding metrics, use a video software like ffmpeg.
Grace Hopper plugin
The grace-hopper plugin collect measurements of CPU and GPU energy usage of NVIDIA Grace and Grace Hopper superchips.
Requirements
- Grace or Grace Hopper superchip
- Grace hwmon sensors enabled
Metrics
Here are the metrics collected by the plugin.
| Name | Type | Unit | Description | Attributes | More information |
|---|---|---|---|---|---|
grace_instant_power | uint | microWatt | Power consumption | sensor | If the resource_kind is LocalMachine then the value is the sum of all sensors of the same type |
grace_energy_consumption | float | milliJoule | Energy consumed since the previous measurement | Sensor | If the resource_kind is LocalMachine then the value is the sum of all sensors of the same type |
The hardware sensors do not provide the energy, only the power. The plugin computes the energy consumption with a discrete integral on the power values.
Attributes
Hardware Sensors
The Grace and Grace Hopper superchips track the power consumption of several areas.
The area is indicated by the sensor attribute of the measurements points.
The base possible values are:
sensor value | Description | Grace | Grace Hopper |
|---|---|---|---|
module | Total power of the Grace Hopper module, including regulator loss and DRAM, GPU and HBM power. | No | Yes |
grace | Power of the Grace socket (the socket number is indicated by the point’s resource id) | Yes | Yes |
cpu | CPU rail power | Yes | Yes |
sysio | SOC rail power | Yes | Yes |
Refer to the next section for more values.
Sums and Estimations
The grace-hopper plugins computes additional values and tag them with a different sensor value, according to the table below.
sensor value | Description |
|---|---|
dram | Estimated power or energy consumption of the DRAM (memory) |
module_total | sum of all module values for the corresponding metric |
grace_total | sum of all grace values |
cpu_total | sum of all cpu values |
sysio_total | sum of all sysio values |
dram_total | sum of all dram values |
Configuration
Here is a configuration example of the Grace-Hopper plugin. It’s part of the Alumet configuration file (eg: alumet-config.toml).
[plugins.grace-hopper]
# Interval between two read of the power.
poll_interval = "1s"
# Root path to look at for hwmon file hierarchy
root_path = "/sys/class/hwmon"
More information
hwmon sysfs
This plugin reads the power telemetry data provided via hwmon.
To enable the hwmon virtual devices for Grace/GraceHopper, configure your system as follows:
-
Kernel Configuration Set the following option in your kernel configuration (
kconfig):CONFIG_SENSORS_ACPI_POWER=m
-
Kernel Command Line Parameter Add the following parameter to your kernel command line:
acpi_power_meter.force_cap_on=y
These settings ensure that the ACPI power meter driver is available and exposes the necessary hwmon interfaces.
You could see your current kernel configuration about the ACPI POWER sensor using:
zcat /proc/config.gz | grep CONFIG_SENSORS_ACPI_POWERgrep CONFIG_SENSORS_ACPI_POWER /boot/config-$(uname -r)modinfo acpi_power_meter
More information can be found on the NVIDIA Grace Platform Configurations Guide.
Jetson plugin
The jetson plugin allows to measure the power consumption of Jetson edge devices by querying their internal INA-3221 sensor(s).
Requirements
This plugin only works on NVIDIA Jetson™ devices. It supports Jetson Linux versions 32 to 36 (JetPack 4.6 to 6.x), and will probably work fine with future versions.
The plugin needs to read files from the sysfs, so it needs to have the permission to read the I2C hierarchy of the INA-3221 sensor(s). Depending on your system, the root of this hierarchy is located at:
/sys/bus/i2c/drivers/ina3221on modern systems,/sys/bus/i2c/drivers/ina3221xon older systems
Metrics
The plugin source can collect the following metrics. Depending on the hardware, some metrics may or may not be collected.
| Name | Type | Unit | Description | Attributes |
|---|---|---|---|---|
input_current | u64 | mA (milli-Ampere) | current intensity on the channel’s line | see below |
input_voltage | u64 | mV (milli-Volt) | current voltage on the channel’s line | see below |
input_power | u64 | mW (milli-Watt) | instantaneous electrical power on the channel’s line | see below |
Attributes
The sensor provides measurements for several channels, which are connected to different parts of the hardware (this depends on the exact model of the device). This is reflected in the attributes attached to the measurement points.
Each measurement point produced by the plugin has the following attributes:
ina_device_number(u64): the sensor’s device numberina_i2c_address(u64): the I2C address of the sensorina_channel_id(u64): the identifier of the channelina_channel_label(str): the label of the channel
Refer to the documentation of your Jetson to learn more about the channels that are available on your device.
Example
On the Jetson Xavier NX Developer Kit, one sensor is connected to the I2C sysfs, at /sys/bus/i2c/drivers/ina3221/7-0040/hwmon/hwmon6. It features 4 channels:
- Channel 1:
VDD_IN- Files
in1_label,curr1_input, etc.
- Files
- Channel 2:
VDD_CPU_GPU_CV- Files
in2_label,in2_input, etc.
- Files
- Channel 3:
VDD_SOC- Files
in2_label,in2_input, etc.
- Files
- Channel 7:
sum of shunt voltages- Files
in7_label,in7_input, etc.
- Files
When measuring the data from channel 1, the plugin will produce measurements with the following attributes:
ina_device_number: 6ina_i2c_address: 0x40(64 in decimal)ina_channel_id: 1ina_channel_label: "VDD_IN"
Configuration
Here is an example of how to configure this plugin.
Put the following in the configuration file of the Alumet agent (usually alumet-config.toml).
[plugins.jetson]
poll_interval = "1s"
flush_interval = "5s"
More information
To find the model of your Jetson, run:
cat /sys/firmware/devicetree/base/model
NVIDIA NVML plugin
The nvml plugin allows to monitor NVIDIA GPUs.
Requirements
- Linux
- NVIDIA GPU(s)
- NVIDIA drivers installed. You probably want to use the packages provided by your Linux distribution.
Metrics
Here are the metrics collected by the plugin’s source(s). One source will be created per GPU device.
| Name | Type | Unit | Description | Resource | ResourceConsumer | Attributes |
|---|---|---|---|---|---|---|
nvml_energy_consumption | Counter Diff | milliJoule | Average between 2 measurement points based on the consumed energy since the last boot | GPU | LocalMachine | |
nvml_instant_power | Gauge | milliWatt | Instant power consumption | GPU | LocalMachine | |
nvml_temperature_gpu | Gauge | Celsius | Main temperature emitted by a given device | GPU | LocalMachine | |
nvml_gpu_utilization | Gauge | Percentage (0-100) | GPU rate utilization | GPU | LocalMachine | |
nvml_gpu_memory_info | Gauge | bytes | GPU VRAM information. Only available with recent versions of NVIDIA drivers ($\geq510$) | GPU | LocalMachine | kind |
nvml_encoder_sampling_period | Gauge | Microsecond | Current utilization and sampling size for the encoder | GPU | LocalMachine | |
nvml_decoder_sampling_period | Gauge | Microsecond | Current utilization and sampling size for the decoder | GPU | LocalMachine | |
nvml_n_compute_processes | Gauge | None | Relevant currently running computing processes data | GPU | LocalMachine | |
nvml_n_graphic_processes | Gauge | None | Relevant currently running graphical processes data | GPU | LocalMachine | |
nvml_memory_utilization | Gauge | Percentage | GPU memory utilization by a process | Process | LocalMachine | |
nvml_encoder_utilization | Gauge | Percentage | GPU video encoder utilization by a process | Process | LocalMachine | |
nvml_decoder_utilization | Gauge | Percentage | GPU video decoder utilization by a process | Process | LocalMachine | |
nvml_sm_utilization | Gauge | Percentage | Utilization of the GPU streaming multiprocessors by a process (3D task and rendering, etc…) | Process | LocalMachine |
Some metrics can be disabled, see the mode configuration option.
Attributes
Kind
The kind of the memory is the type of the allocated memory space reserved by the system or the hardware.
| Value | Description |
|---|---|
free | Unallocated device memory |
total | Total physical device memory |
used | Allocated device memory |
reserved | Device memory (in bytes) reserved for system use (driver or firmware) |
Configuration
Here is an example of how to configure this plugin.
Put the following in the configuration file of the Alumet agent (usually alumet-config.toml).
[plugins.nvml]
# Initial interval between two Nvidia measurements.
poll_interval = "1s"

# Initial interval between two flushing of Nvidia measurements.
flush_interval = "5s"

# On startup, the plugin inspects the GPU devices and detect their features.
# If `skip_failed_devices = true` (or is omitted), inspection failures will be logged and the plugin will continue.
# If `skip_failed_devices = true`, the first failure will make the plugin's startup fail.
skip_failed_devices = true

# See below
mode = "full"
Choosing the Right Mode
The NVML plugin offers two modes: full and minimal.
In full mode, all the metrics listed in the table above are provided (if they are available on the GPU).
If you want to make the GPU measurement faster, you can use the minimal mode.
In minimal mode, only nvml_energy_consumption and nvml_instant_power are provided.
The only measured value is nvml_instant_power. It is used to estimate nvml_energy_consumption.
The minimal mode only works on GPU that support the nvmlDeviceGetPowerUsage device query (the plugin detects if this is the case on startup).
More information
Not all software use the GPU to its full extent.
For instance, to obtain non-zero values for the video encoding/decoding metrics, use a video software like ffmpeg.
GPU counter updates
NVML requires 20-100ms to refresh counter values based on GPU model.
When poll_interval is set too low, the plugin queries identical counter values repeatedly during polling.
Since some measurements are calculated from previous polls, these measurements are discarded rather than reported as zero values.
Note on NVIDIA ‘utilization’
When NVIDIA measures ‘utilization’, they actually mean the percent of time that the resource was solicited over the last sample of time.
For example, if memory utilization $= 60%$, then it means that during the last sample of time (for instance, the past 1 second), 60% of that time ($=600ms$) was spent reading or writing the memory.
This is also true for nvml_gpu_utilization, nvml_memory_utilization, nvml_encoder_utilization, nvml_decoder_utilization and nvml_sm_utilization.
Perf plugin
The perf plugin creates an Alumet source that collects measurements using the Performance Counters for Linux (aka perf_events).
It can obtain valuable data about the system and/or a specific process, such as the number of instructions executed, cache-misses suffered, …
This plugin works in a similar way to the perf command-line tool.
Requirements
- Linux (
perf_eventsis a kernel feature) - Required capabilities.
Metrics
Here are the metrics collected by the plugin’s source. All the metrics are counters.
To learn more about the standard events, please refer to the perf_event_open manual.
To list the events that are available on your machine, run the perf list command.
For hardware related metrics:
perf_hardware_{hardware-event-name} where hardware-event-name is one of:
CPU_CYCLES, INSTRUCTIONS, CACHE_REFERENCES, CACHE_MISSES, BRANCH_INSTRUCTIONS, BRANCH_MISSES, BUS_CYCLES, STALLED_CYCLES_FRONTEND, STALLED_CYCLES_BACKEND, REF_CPU_CYCLES.
For software related metrics:
perf_software_{software-event-name} where software-event-name is one of:
PAGE_FAULTS, CONTEXT_SWITCHES, CPU_MIGRATIONS, PAGE_FAULTS_MIN, PAGE_FAULTS_MAJ, ALIGNMENT_FAULTS, EMULATION_FAULTS, CGROUP_SWITCHES.
For cache related metrics:
perf_cache_{cache-id}_{cache-op}_{cache-result} where:
cache-id is one of L1D, L1I, LL, DTLB, ITLB, BPU, NODE
cache-op is one of READ, WRITE or PREFETCH.
cache-result is one of ACCESS or MISS.
Note that based on your kernel version, some events could be unavailable.
Attributes
Configuration
Here is a configuration example of the plugin. It’s part of the Alumet configuration file (eg: alumet-config.toml).
[plugins.perf]
# Description.
poll_interval = "1s"
flush_interval = "1s"
hardware_events = [
    "REF_CPU_CYCLES",
    "CACHE_MISSES",
    "BRANCH_MISSES",
#   // any {hardware-event-name} from the list previously mentionned
]
software_events = [
    "PAGE_FAULTS",
    "CONTEXT_SWITCHES",
#   // any {software-event-name} from the list previously mentionned
]
cache_events = [
    "LL_READ_MISS",
#   // any combination of {cache-id}_{cache-op}_{cache-result} from the lists previously mentionned
]
More information
perf_event_paranoid and capabilities
| perf_event_paranoid value | Description | Required capabilities (binary) | perf plugin works (unprivileged) |
Below is a summary of how different perf_event_paranoid values affect perf plugin functionality when running as an unprivileged user:
perf_event_paranoid value | Description | Required capabilities (binary) | RAPL plugin works (unprivileged) |
|---|---|---|---|
| 4 (Debian-based systems only) | Disables all perf event usage for unprivileged users | − | ❌ Not supported |
| 2 | Allows only user-space measurements | cap_perfmon (or cap_sys_admin for Linux < 5.8) | ✅ Supported |
| 1 | Allows user-space and kernel-space measurements | cap_perfmon (or cap_sys_admin for Linux < 5.8) | ✅ Supported |
| 0 | Allows user-space, kernel-space, and CPU-specific data | cap_perfmon (or cap_sys_admin for Linux < 5.8) | ✅ Supported |
| -1 | Full access, including raw tracepoints | − | ✅ Supported |
Example for setting perf_event_paranoid: sudo sysctl -w kernel.perf_event_paranoid=2 will set the value to 2.
Note that this command will not make it permanent (reset after restart).
To make it permanent, create a configuration file in /etc/sysctl.d/ (this may change depending on your Linux distro).
Alternatively, you can run Alumet as a privileged user (root), but this is not recommended for security reasons.
Procfs plugin
Collects processes and system-related metrics by reading the proc virtual filesystem on Linux based operating systems.
Requirements
- Linux operating system.
- Read access to the
/procvirtual file system. Depending on the mount options, some privileges might be needed.
Metrics
There are various information collected by this plugin relative to Kernel, CPU, memory, network and processes:
| Name | Type | Unit | Description | Resource | ResourceConsumer | Attributes |
|---|---|---|---|---|---|---|
kernel_cpu_time | CounterDiff | millisecond | Time during the CPU is busy | LocalMachine | LocalMachine | cpu_state |
kernel_context_switches | CounterDiff | none | Number of context switches* | LocalMachine | LocalMachine | |
kernel_new_forks | CounterDiff | none | Number of forked operations* | LocalMachine | LocalMachine | |
kernel_n_procs_running | Gauge | none | Number of processes in a runnable state | LocalMachine | LocalMachine | |
kernel_n_procs_blocked | Gauge | none | Numbers of processes that are blocked on input/output operations | LocalMachine | LocalMachine | |
cpu_time_delta | CounterDiff | millisecond | CPU usage | LocalMachine | Process | kind |
memory_usage | Gauge | bytes | Memory usage | LocalMachine | Process | kind |
network_bytes | Gauge | bytes | Tx/Rx bytes per interface | LocalMachine | LocalMachine | direction,interface |
network_packets | Gauge | bytes | Tx/Rx packets per interface | LocalMachine | LocalMachine | direction,interface |
network_packet_drops | Gauge | bytes | Tx/Rx packets dropped per interface | LocalMachine | LocalMachine | direction,interface |
network_errors | Gauge | bytes | Tx/Rx network errors per interface | LocalMachine | LocalMachine | direction,interface |
- *Context switches: Operation allowing a single CPU to manage multiple processes efficiently, involves saving the state of a currently running process and loading the state of another process, enabling multitasking and optimal CPU utilization.
- *Forks: When a process creates a copy of itself.
Attributes
Kind
The kind of the memory is the allocated memory space reserved by the system or the hardware (https://man7.org/linux/man-pages/man5/proc_pid_status.5.html):
| Value | Description |
|---|---|
resident | Resident set size (same as VmRSS in /proc/<pid>/status) |
shared | Number of resident shared pages (i.e., backed by a file) (same as RssFile+RssShmem in /proc/<pid>/status) |
virtual | Virtual memory size (same as VmSize in /proc/<pid>/status) |
The kind of the CPU time delta is the average CPU time spent by various tasks:
| Value | Description |
|---|---|
user | Time spent in user mode |
system | Time spent in system mode |
guest | Time spent running a virtual CPU for guest operating systems under control of the linux kernel |
cpu_state
The CPU states is an attribute that indicates the kind of cpu time that is measured:
| Value | Description |
|---|---|
user | Time spent in user mode |
nice | Time spent in user mode with low priority (nice) |
system | Time spent in system mode |
idle | Time spent in the idle state |
irq | Time servicing interrupts |
softirq | Time servicing soft interrupts |
steal | Time of stolen time. Stolen time is the time spent in other operating systems when running in a virtualized environment. |
guest | Time spent running a virtual CPU for guest operating systems under control of the linux kernel |
guest_nice | Time spent running a niced guest |
Configuration
Here is a configuration example of the plugin. It is composed of different sections. Each section can be enabled or disabled with the enabled boolean parameter.
Kernel metrics
To active the plugin to collect metrics relative to the kernel utilization:
[plugins.procfs.kernel]
# `true` to enable the monitoring of kernel information.
enabled = true
# Interval between two measurements.
poll_interval = "5s"
Memory metrics
Moreover, you can collect more or less precise metrics on memory consumption, by setting the level of detail you want to extract from /proc/meminfo file (refers to https://man7.org/linux/man-pages/man5/proc_meminfo.5.html). The names of the collected metrics are converted to snake case (MemTotal becomes mem_total):
[plugins.procfs.memory]
# `true` to enable the monitoring of memory information.
enabled = true
# Interval between two measurements.
poll_interval = "5s"
# The entry to parse from `/proc/meminfo`.
metrics = [
    "MemTotal",
    "MemFree",
    "MemAvailable",
    "Cached",
    "SwapCached",
    "Active",
    "Inactive",
    "Mapped",
]
Network metrics
When enabled, it can also provide RX/TX network metrics per interface at the host level. It provides access to bytes, packets, drops and errors from /proc/net/dev:
[plugins.procfs.network]
# `true` to enable the monitoring of host network information.
enabled = true
# Interval between two measurements.
poll_interval = "5s"
Process metrics
To enable process monitoring, you need to set the metrics collect policy via a strategy:
watcher: Default strategy of system watcher to collect new processes, whatever it may be.event: Set this parameter to collect the process that acts as an internal event of ALUMET.
[plugins.procfs.processes]
# `true` to enable the monitoring of processes.
enabled = true
# Watcher refresh interval.
refresh_interval = "2s"
# `true` to watch for new processes, `false` to only react to ALUMET events.
strategy = "watcher"
Group process metrics
Also, you can monitor groups of processes, i.e. processes defined by common characteristics. The available filters are pid (process id), ppid (parent process id) and exe_regex (a regular expression that must match the process executable path):
[[plugins.procfs.processes.groups]]
# Only monitor the processes whose executable path matches this regex.
exe_regex = ""
# Interval between two measurements.
poll_interval = "2s"
# How frequently should the processes information be flushed to the rest of the pipeline.
flush_interval = "4s"
More information
Procfs Access
To grant the required access to retrieve all metrics properly by reading /proc filesystem, you need to configure the parameter hidepid by editing the configuration file /proc/mounts. This setting is a mount option for the /proc filesystem, that is used to control the visibility of processes to unprivileged users. In this way, it can define the access restriction to /proc/<pid>/ directories, and therefore visibility of processes stats.
By default, the hidepid parameter is generally set to allow the full access to /proc/<pid>/ directories on Linux systems. If your system was configured differently, you must edit the configuration file /proc/mounts, and root privileges may be required for this operation.
mount -o remount,hidepid=0 -t proc proc /proc
Which results in a remount on the /proc mount point with full visibility of all user processes on the system. If you want to set a precise visibility, here are its available configuration values:
| Value | Description |
|---|---|
| 0 | default: Everybody may access all /proc/<pid>/ directories |
| 1 | noaccess: Users may not access any /proc/<pid>/ directories but their own |
| 2 | invisible: All /proc/<pid>/ will be fully invisible to other users |
| 4 | ptraceable: Procfs should only contain /proc/<pid>/ directories that the caller can ptrace. The capability CAP_SYS_PTRACE may be required for PTraceable configuration |
Quarch Plugin
This plugin measures disk power consumption using a Quarch Power Analysis Module. It provides real-time power monitoring in watts and is designed to work with Grid’5000 nodes (e.g., yeti-4 in Grenoble) or any other devices connected to a Quarch Module.
Requirements
Hardware
- A Quarch Power Analysis Module.
- If you want to use it on Grid’5000:
- Have an account on Grid’5000.
- Use a Grenoble node (Quarch module is physically installed on
yeti-4node).
Software
- A working
quarchpyinstallation (Python package) - A Java runtime (configured in
java_bin, provided byquarchpy).
Metrics
The plugin exposes the following metric:
| Name | Type | Unit | Description | Resource | ResourceConsumer | Attributes | More Information |
|---|---|---|---|---|---|---|---|
disk_power_W | F64 | W | Disk power consumption in Watts | local_machine | local_machine | - | Sample is controlled via poll_interval |
Sampling rate is controlled via the plugin configuration (sample, poll_interval).
Configuration
Here is a configuration example of the plugin. It’s part of the Alumet configuration file (e.g., alumet-config.toml).
[plugins.quarch]
# --- Quarch connection configuration ---
quarch_ip = "1.2.3.4" # IP address of the module, e.g., "172.17.30.102" for Grenoble Grid'5000
quarch_port = 9760 # Default if unchanged on your module
qis_port = 9780 # Default if unchanged on your module
java_bin = "path_to_java" # Installed with quarchpy: ".../lib/python3.11/site-packages/quarchpy/connection_specific/jdk_jres/lin_amd64_jdk_jre/bin/java"
qis_jar_path = "path_to_qis" # Installed with quarchpy: ".../lib/python3.11/site-packages/quarchpy/connection_specific/QPS/win-amd64/qis/qis.jar"

# --- Measurement configuration ---
poll_interval = "150ms" # Interval between two reported measurements
flush_interval = "1500ms" # Interval between flushing buffered data
Notes:
poll_intervalcontrols how often Alumet queries the Quarch module.flush_intervalcontrols how often buffered measurements are sent downstream.- Ensure
java_binandqis_jar_pathare correct (installed with quarchpy).
Recommended poll_interval and flush_interval
| Sample | ~Hardware Window | poll_interval (recommended) | flush_interval (recommended) |
|---|---|---|---|
| 32 | 0.13 ms | 200 µs | 2 ms |
| 64 | 0.25 ms | 300 µs | 3 ms |
| 128 | 0.5 ms | 500 µs | 5 ms |
| 256 | 1 ms | 1 ms | 10 ms |
| 512 | 2 ms | 2 ms | 20 ms |
| 1K (1024) | 4.1 ms | 5 ms | 50 ms |
| 2K (2048) | 8.2 ms | 10 ms | 100 ms |
| 4K (4096) | 16.4 ms | 20 ms | 200 ms |
| 8K (8192) | 32.8 ms | 50 ms | 500 ms |
| 16K (16384) | 65.5 ms | 100 ms | 1 s |
| 32K (32768) | 131 ms | 150 ms | 1500 ms |
Notes:
- Choosing
poll_interval<hardware window(min 0.13 ms) may result in repeated identical readings. - Choosing
poll_interval>hardware window(max 131 ms) may skip some module measurements, which is acceptable depending on your experiment duration. For example, if you want 1 poll per second,poll_interval= 1s will work.
Usage
Virtual environment (recommended)
To isolate quarchpy, create a Python virtual environment:
$ python3 -m venv /root/<Name_Virtual_Environnement> && \
/root/<Name_Virtual_Environnement>/bin/pip install --upgrade pip && \
/root/<Name_Virtual_Environnement>/bin/pip install --upgrade quarchpy
$ source /root/<Name_Virtual_Environnement>/bin/activate
Commands
# Run a command while measuring disk power
$ alumet-agent --plugins quarch exec <COMMAND_TO_EXEC>

# Run alumet with continuous measurements
$ alumet-agent --plugins quarch run

# Save results to CSV (with another plugin)
$ alumet-agent --output-file "measurements-quarch.csv" --plugins quarch,csv run
Usage on Grid’5000
- The Quarch Module is physically installed on yeti-4 (Grenoble).
- You can access it from any Grenoble node.
- Example configuration for G5K:
quarch_ip = "172.17.30.102"
quarch_port = 9760
qis_port = 9780
Outputs examples
Alumet:
...
[2025-09-01T10:45:40Z INFO  alumet::agent::builder] Plugin startup complete.
    🧩 1 plugins started:
        - quarch v0.1.0

    ⭕ 24 plugins disabled: ...
    📏 1 metric registered:
        - disk_power: F64 (W)
    📥 1 source, 🔀 0 transform and 📝 0 output registered.
...
With csv plugin:
| metric | timestamp | value | resource_kind | resource_id | consumer_kind | consumer_id | __late_attributes |
|---|---|---|---|---|---|---|---|
| disk_power_W | 2025-09-01T10:45:41.757250914Z | 9.526866534 | local_machine | local_machine | |||
| disk_power_W | 2025-09-01T10:45:42.723658463Z | 9.526885365 | local_machine | local_machine | |||
| disk_power_W | 2025-09-01T10:45:43.723659913Z | 9.528410676 | local_machine | local_machine | |||
| disk_power_W | 2025-09-01T10:45:44.723650353Z | 9.528114186 | local_machine | local_machine |
Troubleshooting
- No metrics appear: check
quarch_ip / ports, and ensure module is powered on. - Java errors: verify
java_binpath from your quarchpy install. - QIS not found: update
qis_jar_pathto the correct installed JAR.
License
Copyright 2025 Marie-Line DA COSTA BENTO.
Alumet project is licensed under the European Union Public Licence (EUPL). See the LICENSE file for more details.
More information
Quarch module commands are based on the SCPI specification.
Commands formats come from the technical manual of the power analysis module. Here is an excerpt:
RECord:AVEraging [rate]
RECord:AVEraging?
RECord:AVEraging:GROup [#number] [rate]
RECord:AVEraging:[#number]?

By default, the module collects samples at a rate of 250,000 samples per second. This can be reduced by averaging across multiple measurements to give a longer recorded period.
For further details, please check the Quarch Github.
RAPL plugin
The RAPL plugin creates an Alumet source that collects measurements of processor energy usage via RAPL interfaces, such as perf-events and powercap.
Requirements
- RAPL-compatible processor
- Linux (the plugin relies on abstractions provided by the kernel - perf-events and powercap)
- Specific for perf-events usage: See perf_event_paranoid and capabilities requirements.
- Specific for powercap usage: Ensure read access to everything in
/sys/devices/virtual/powercap/intel-rapl(eg:sudo chmod a+r -R /sys/devices/virtual/powercap/intel-rapl). - Specific for containers: Read this documentation about rapl plugin capabilities.
Metrics
Here are the metrics collected by the plugin source.
| Name | Type | Unit | Description | Attributes | More information |
|---|---|---|---|---|---|
rapl_consumed_energy | Counter Diff | joule | Energy consumed since the previous measurement | domain |
Attributes
Domain
A domain is a specific area of power consumption tracked by RAPL. The possible domain values are:
| Value | Description |
|---|---|
platform | the entire machine - ⚠️ may vary depending on the model |
package | the CPU cores, the iGPU, the L3 cache and the controllers |
pp0 | the CPU cores |
pp1 | the iGPU |
dram | the RAM attached to the processor |
Configuration
Here is a configuration example of the RAPL plugin. It’s part of the Alumet configuration file (eg: alumet-config.toml).
[plugins.rapl]
# Interval between two RAPL measurements.
poll_interval = "1s"
# Interval between two flushing of RAPL measurements.
flush_interval = "5s"
# Set to true to disable perf-events and always use the powercap sysfs.
no_perf_events = false
More information
Should I use perf-events or powercap ?
Both interfaces provide similar energy consumption data, but we recommend using perf-events for lower measurement overhead (especially in high-frequency polling scenarios).
For a more detailed technical comparison, see this publication on RAPL measurement methods.
perf_event_paranoid and capabilities
You should read this section in case you’re using perf-events to collect measurements.
perf_event_paranoid is a Linux kernel setting that controls the level of access that unprivileged (non-root) users have to access features provided by the perf subsystem which can be used in this plugin (should I use perf-events or powercap).
Below is a summary of how different perf_event_paranoid values affect RAPL plugin functionality when running as an unprivileged user:
perf_event_paranoid value | Description | Required capabilities (binary) | RAPL plugin works (unprivileged) |
|---|---|---|---|
| 4 (Debian-based systems only) | Disables all perf event usage for unprivileged users | – | ❌ Not supported |
| 2 | Allows only user-space measurements | cap_perfmon (or cap_sys_admin for Linux < 5.8) | ✅ Supported |
| 1 | Allows user-space and kernel-space measurements | cap_perfmon (or cap_sys_admin for Linux < 5.8) | ✅ Supported |
| 0 | Allows user-space, kernel-space, and CPU-specific data | cap_perfmon (or cap_sys_admin for Linux < 5.8) | ✅ Supported |
| -1 | Full access, including raw tracepoints | – | ✅ Supported |
Example for setting perf_event_paranoid: sudo sysctl -w kernel.perf_event_paranoid=2 will set the value to 2.
Note that this command will not make it permanent (reset after restart).
Alternatively, you can run Alumet as a privileged user (root), but this is not recommended for security reasons.
Raw cgroups plugin
The cgroups plugin gathers measurements about Linux control groups.
Requirements
Metrics
Here are the metrics collected by the plugin’s sources.
| Name | Type | Unit | Description | Resource | ResourceConsumer | Attributes |
|---|---|---|---|---|---|---|
cpu_time_delta | Delta | nanoseconds | time spent by the pod executing on the CPU | LocalMachine | Cgroup | see below |
cpu_percent | Gauge | Percent (0 to 100) | cpu_time_delta / delta_t (1 core used fully = 100%) | LocalMachine | Cgroup | see below |
memory_usage | Gauge | Bytes | total pod’s memory usage | LocalMachine | Cgroup | see below |
cgroup_memory_anonymous | Gauge | Bytes | anonymous memory usage | LocalMachine | Cgroup | see below |
cgroup_memory_file | Gauge | Bytes | memory used to cache filesystem data | LocalMachine | Cgroup | see below |
cgroup_memory_kernel_stack | Gauge | Bytes | memory allocated to kernel stacks | LocalMachine | Cgroup | see below |
cgroup_memory_pagetables | Gauge | Bytes | memory reserved for the page tables | LocalMachine | Cgroup | see below |
Attributes
The cpu measurements have an additional attribute kind, which can be one of:
total: time spent in kernel and user modesystem: time spent in kernel mode onlyuser: time spent in user mode only
Configuration
Here is an example of how to configure this plugin.
Put the following in the configuration file of the Alumet agent (usually alumet-config.toml).
[plugins.cgroups]
# Interval between each measurement.
poll_interval = "1s"
Automatic Detection
The version of the control groups and the mount point of the cgroupfs are automatically detected.
The plugin watches for the creation and deletion of cgroups.
With cgroup v2, the detection is almost instantaneous, because it relies on inotify.
With cgroup v1, however, cgroups are repeatedly polled. The refresh interval is 30s, and it is currently not possible to change it in the plugin’s configuration.
More information
To monitor HPC jobs or Kubernetes pods, use the OAR, Slurm or K8S plugins. They provide more information about the jobs/pods, such as their id.
OAR plugin
The oar plugin gathers measurements about OAR jobs.
Requirements
- A node with OAR installed and running. Both OAR 2 and OAR 3 are supported (config required).
- Both cgroups v1 and cgroups v2 are supported. Some metrics may not be available with cgroups v1.
Metrics
Here are the metrics collected by the plugin’s sources.
| Name | Type | Unit | Description | Resource | ResourceConsumer | Attributes |
|---|---|---|---|---|---|---|
cpu_time_delta | Delta | nanoseconds | time spent by the pod executing on the CPU | LocalMachine | Cgroup | see below |
cpu_percent | Gauge | Percent (0 to 100) | cpu_time_delta / delta_t (1 core used fully = 100%) | LocalMachine | Cgroup | see below |
memory_usage | Gauge | Bytes | total pod’s memory usage | LocalMachine | Cgroup | see below |
cgroup_memory_anonymous | Gauge | Bytes | anonymous memory usage | LocalMachine | Cgroup | see below |
cgroup_memory_file | Gauge | Bytes | memory used to cache filesystem data | LocalMachine | Cgroup | see below |
cgroup_memory_kernel_stack | Gauge | Bytes | memory allocated to kernel stacks | LocalMachine | Cgroup | see below |
cgroup_memory_pagetables | Gauge | Bytes | memory reserved for the page tables | LocalMachine | Cgroup | see below |
Attributes
The measurements produced by the slurm plugin have the following attributes:
job_id: id of the OAR job.user_id: id of the user that submitted the job.
The cpu measurements have an additional attribute kind, which can be one of:
total: time spent in kernel and user modesystem: time spent in kernel mode onlyuser: time spent in user mode only
Augmentation of the measurements of other plugins
The oar plugin adds attributes to the measurements of the other plugins.
If a measurement does not have a job_id attribute, it gets a new involved_jobs attribute, which contains a list of the ids of the jobs that are running on the node (at the time of the transformation).
This allows to know, for each measurement, which job was running at that time. For the reasoning behind this feature, see issue #209.
Annotation of the Measurements Provided by Other Plugins
Other plugins, such as the process-to-cgroup-bridge, can produce measurements related to the cgroups of OAR jobs.
However, they cannot add job-specific information (such as the job id) to the measurements.
To do that, use the annotation feature of the oar plugin by enabling the following configuration option.
annotate_foreign_measurements = true
Be sure to enable the oar plugin after the plugins that produce the measurements that you want to annotate.
For instance, the oar configuration section should be after the process-to-cgroup-bridge section.
[plugins.process-to-cgroup-bridge]
…

[plugins.oar]
…
Configuration
Here is an example of how to configure this plugin.
Put the following in the configuration file of the Alumet agent (usually alumet-config.toml).
[plugins.oar]
# The version of OAR, either "oar2" or "oar3".
oar_version = "oar3"
# Interval between each measurement.
poll_interval = "1s"
# If true, only monitors jobs and ignore other cgroups.
jobs_only = true
Slurm plugin
The slurm plugin gathers measurements about Slurm jobs.
Requirements
- A node with Slurm installed and running.
- The Slurm plugin relies on cgroups for its operation. Knowing that, your slurm cluster should have the cgroups enabled. Here is the official documentation about how to setup this.
Metrics
Here are the metrics collected by the plugin’s sources.
| Name | Type | Unit | Description | Resource | ResourceConsumer | Attributes |
|---|---|---|---|---|---|---|
cpu_time_delta | Delta | nanoseconds | time spent by the pod executing on the CPU | LocalMachine | Cgroup | see below |
cpu_percent | Gauge | Percent (0 to 100) | cpu_time_delta / delta_t (1 core used fully = 100%) | LocalMachine | Cgroup | see below |
memory_usage | Gauge | Bytes | total pod’s memory usage | LocalMachine | Cgroup | see below |
cgroup_memory_anonymous | Gauge | Bytes | anonymous memory usage | LocalMachine | Cgroup | see below |
cgroup_memory_file | Gauge | Bytes | memory used to cache filesystem data | LocalMachine | Cgroup | see below |
cgroup_memory_kernel_stack | Gauge | Bytes | memory allocated to kernel stacks | LocalMachine | Cgroup | see below |
cgroup_memory_pagetables | Gauge | Bytes | memory reserved for the page tables | LocalMachine | Cgroup | see below |
Attributes
The measurements produced by the slurm plugin have the following attributes:
job_id: id of the Slurm job, for example10707.job_step: id of the Slurm job, for example2(the full job id with its step is10707.2and thejob_stepattribute contains only the step number2).
The cpu measurements have an additional attribute kind, which can be one of:
total: time spent in kernel and user modesystem: time spent in kernel mode onlyuser: time spent in user mode only
Annotation of the Measurements Provided by Other Plugins
Other plugins, such as the process-to-cgroup-bridge, can produce measurements related to the cgroups of Slurm jobs.
However, they cannot add job-specific information (such as the job id) to the measurements.
To do that, use the annotation feature of the slurm plugin by enabling the following configuration option.
annotate_foreign_measurements = true
Be sure to enable the slurm plugin after the plugins that produce the measurements that you want to annotate.
For instance, the slurm configuration section should be after the process-to-cgroup-bridge section.
[plugins.process-to-cgroup-bridge]
…

[plugins.slurm]
…
Configuration
Here is an example of how to configure this plugin.
Put the following in the configuration file of the Alumet agent (usually alumet-config.toml).
[plugins.slurm]
# Interval between two measurements.
poll_interval = "1s"

# Interval between two scans of the cgroup v1 hierarchies.
# Only applies to cgroup v1 hierarchies (cgroupv2 supports inotify).
cgroupv1_refresh_interval = "30s"

# Only monitor the cgroups related to slurm jobs.
# If set to false, non-jobs will also be monitored.
ignore_non_jobs = true

# At which level should we measure jobs? The possible levels are:
# - "job": only monitor the top-level cgroup of each job
# - "step": measure jobs and steps
# - "substep": measure jobs, steps and substeps
# - "task": measure jobs, steps, substeps and tasks
jobs_monitoring_level = "job"

# If true, start the sources in "paused" state.
# This is useful in combination with other plugins that will resume the sources.
add_source_in_pause_state = false
Levels of Detail
Slurm organizes the execution of calculations into several nested levels. Each level obtain a corresponding Linux control group (“cgroup”).
Example:
job_12/
├─ step_34/
   ├─ substep/
      ├─ task_56/
- job: the object that the users submit to Slurm.
- job step: an execution instance launched within a job. A job can contain several sequential or parallel steps.
- substep: sub-step control group. In a typical Slurm installation with cgroup v2, every step gets divided in two parts, which we call “substeps”:
userandslurm. Theslurmstepdprogram, which manages the step, lives in theslurmsubstep. - task: the smallest unit of a Slurm job, the task to execute.
Change the value of jobs_monitoring_level to select the level of details that you need.
For more details about Slurm jobs, please refer to the official Slurm documentation.
Kwollect-input Plugin
The Kwollect-input plugin creates a source in Alumet that collects processor energy usage measurements via Kwollect on the Grid’5000 platform. Currently, it mainly gathers power consumption data (in watts) on only one node at a time.
Requirements
- You must have an account on Grid’5000.
- You want to collect Kwollect data, specifically wattmeter measurements, on a node.
The clusters & nodes that support wattmeter are as follows:
- grenoble: servan, troll, yeti
- lille: chiroptera
- lyon: gemini, neowise, nova, orion, pyxis, sagittaire, sirius, taurus
- nancy: gros⁺
- rennes: paradoxe
Example Metrics Collected
Here is an example of the metrics collected by the plugin:
| Metric | Timestamp | Value (W) | Resource Type | Resource ID | Consumer Type | Consumer ID | Metric ID |
|---|---|---|---|---|---|---|---|
| wattmetre_power_watt_W | 2025-07-22T08:28:12.657Z | 129.69 | device_id | taurus-7 | device_origin | wattmetre1-port6 | wattmetre_power_watt |
| wattmetre_power_watt_W | 2025-07-22T08:28:12.657Z | 128.80 | device_id | taurus-7 | device_origin | wattmetre1-port6 | wattmetre_power_watt |
| … | … | … | … | … | … | … | … |
Each entry represents a power measurement in watts, with a precise timestamp, node name (e.g., “taurus-7”), and device identifier (e.g., “wattmetre1-port6”).
Configuration
Here is a configuration example of the plugin. It’s part of the Alumet configuration file (e.g., alumet-config.toml):
[plugins.kwollect-input]
site = "CLUSTER"                  # Grid'5000 site
hostname = "NODE"                 # Target node hostname
metrics = "wattmetre_power_watt"  # Metric to collect, DO NOT CHANGE IT
login = "YOUR_G5K_LOGIN"          # Your Grid'5000 username
password = "YOUR_G5K_PASSWORD"    # Your Grid'5000 password
Usage
To run Alumet with this plugin, use:
alumet-agent --plugins kwollect-input exec ...
You can add other plugins as needed, for example to save data to a CSV file:
alumet-agent --output-file "measurements-kwollect.csv" --plugins csv,kwollect-input exec ...
Example Output
Here’s an excerpt from the logs showing that the API is called successfully:
...
[2025-08-05T07:44:46Z INFO  alumet::agent::exec] Child process exited with status exit status: 0, Alumet will now stop.
[2025-08-05T07:44:46Z INFO  alumet::agent::exec] Publishing EndConsumerMeasurement event
[2025-08-05T07:44:46Z INFO  plugin_kwollect_input] API request should be triggered with URL: https://api.grid5000.fr/stable/sites/lyon/metrics?nodes=taurus-7&metrics=wattmetre_power_watt&start_time=1754379876&end_time=1754379886
[2025-08-05T07:44:46Z INFO  plugin_kwollect_input::source] Polling KwollectSource
[2025-08-05T07:44:48Z INFO  alumet::agent::builder] Stopping the plugins...
...
Some advice
- Verify the Kwollect API is active for your node and not under maintenance with the status tool.
- Verify if the wattmeters work on the node you want to use by looking at the API URL with the time format
year-month-dayThour:minutes:seconds:https://api.grid5000.fr/stable/sites/{site}/metrics?nodes={node}&start_time={now}&end_time={at least +1s}
License
Copyright 2025 Marie-Line DA COSTA BENTO.
Alumet project is licensed under the European Union Public Licence (EUPL). See the LICENSE file for more details.
More Information
For further details, please check the Kwollect documentation.
K8S plugin
The k8s plugin gathers measurements about Kubernetes pods.
Requirements
You need:
- A Kubernetes cluster
- A ServiceAccount token (see the configuration section)
We do not require a minimum version, because our use of the API is very minimal.
To test the plugin locally, you can use minikube.
Metrics
Here are the metrics collected by the plugin’s sources.
| Name | Type | Unit | Description | Resource | ResourceConsumer | Attributes |
|---|---|---|---|---|---|---|
cpu_time_delta | Delta | nanoseconds | time spent by the pod executing on the CPU | LocalMachine | Cgroup | see below |
cpu_percent | Gauge | Percent (0 to 100) | cpu_time_delta / delta_t (1 core used fully = 100%) | LocalMachine | Cgroup | see below |
memory_usage | Gauge | Bytes | total pod’s memory usage | LocalMachine | Cgroup | see below |
cgroup_memory_anonymous | Gauge | Bytes | anonymous memory usage | LocalMachine | Cgroup | see below |
cgroup_memory_file | Gauge | Bytes | memory used to cache filesystem data | LocalMachine | Cgroup | see below |
cgroup_memory_kernel_stack | Gauge | Bytes | memory allocated to kernel stacks | LocalMachine | Cgroup | see below |
cgroup_memory_pagetables | Gauge | Bytes | memory reserved for the page tables | LocalMachine | Cgroup | see below |
Attributes
The measurements produced by the k8s plugin have the following attributes:
uid: the pod’s UUIDname: the pod’s namenamespace: the pod’s namespacenode: the name of the node (see the configuration)
The cpu measurements have an additional attribute kind, which can be one of:
total: time spent in kernel and user modesystem: time spent in kernel mode onlyuser: time spent in user mode only
Configuration
Here are some examples of how to configure this plugin.
Example Configuration for Minikube
Context: you have started Minikube on your local machine and want to run Alumet alongside of it (not in a pod).
Prerequisites:
- create a namespace and service account:
kubectl create ns alumet
kubectl create serviceaccount alumet-reader -n alumet
The service account’s token will be created and retrieved by the k8s Alumet plugin itself.
- Make the K8S API available locally:
kubectl proxy --port=8080
Then, you can use the following configuration:
[plugins.k8s]
k8s_node = "minikube"
k8s_api_url = "http://127.0.0.1:8080"
token_retrieval = "auto"
poll_interval = "5s"
Example Configuration for a full K8S Cluster
Context: you have a K8S cluster and are deploying Alumet in a pod.
Prerequisites:
- Inject the name of the node in the
NODE_NAMEenvironment variable of the pod that runs the Alumet agent. See K8S Docs − Expose Pod Information to Containers Through Environment Variables. - Create a ServiceAccount and mount its token in the pod that runs the Alumet agent.
Then, configure the k8s plugin.
A typical configuration would look like the following:
[plugins.k8s]
k8s_node = "${NODE_NAME}"
k8s_api_url = "https://kubernetes.default.svc:443"
token_retrieval = "file"
poll_interval = "5s"
Possible Token Retrieval Strategies
# try "file" and fall back to "kubectl"
token_retrieval = "auto"

# run 'kubectl create token'
token_retrieval = "kubectl"

# read /var/run/secrets/kubernetes.io/serviceaccount/token
token_retrieval = "file"

# custom file
token_retrieval.file = "/path/to/token"

# custom kubectl
token_retrieval.kubectl = {
    service_account = "alumet-reader"
    namespace = "alumet"
}
Data Transforms
Data transforms are functions that modify the measurements as they arrive (online processing).
To get the measurements that you want, you should enable the relevant plugins. This section documents the plugins that provide transforms.
Order of the Transforms
Some transforms only work properly if they run after other transforms.
With the standard Alumet agent, the transforms order is set to the order of the plugins’ configuration.
For instance, if you have two plugins that provide transforms, a and b, and you want transform a to always run before transform b, your configuration should look like this:
# Run transforms of plugin a first, then run transforms of plugin b.
[plugins.a]
# ...

[plugins.b]
# ...
Energy attribution plugin
The energy-attribution plugin combines measurements related to the energy consumption of some hardware components with measurements related to the use of the hardware by the software.
It computes a value per resource per consumer, using the formula of your choice (configurable).
Requirements
To obtain hardware and software measurements, you need to enable other plugins such as:
raplprocfsamd-gpunvidia-nvml
Metrics
This plugin creates new measurements based on its configuration.
| Name | Type | Unit | Description | Resource | ResourceConsumer | Attributes | More information |
|---|---|---|---|---|---|---|---|
| chosen by the config | Gauge | Joules | attributed energy | depends on the config | depends on the config | same as the input measurements |
Configuration
Here is an example of how to configure this plugin.
Put the following in the configuration file of the Alumet agent (usually alumet-config.toml).
You can configure multiple formulas. Be sure to give each formula a unique name.
For instance, you can have a table formulas.attributed_energy_cpu and a table formulas.attributed_energy_gpu.
CPU example
In this example, we define an attribution formula that produces a new metric attributed_energy_cpu by combining cpu_energy and cpu_usage.
[plugins.energy-attribution.formulas.attributed_energy_cpu]
# the expression used to compute the final value
expr = "cpu_energy * cpu_usage / 100.0"
# the time reference: this is a timeseries, defined by a metric (and other criteria, see below), that will not change during the transformation. Other timeseries can be interpolated in order to have the same timestamps before applying the formula.
ref = "cpu_energy"

# Timeseries related to the resources.
[plugins.energy-attribution.formulas.attributed_energy_cpu.per_resource]
# Defines the timeseries `cpu_energy` that is used in the formula, as the measurement points that have:
# - the metric `rapl_consumed_energy`,
# - and the resource kind `"local_machine"`
# - and the attribute `domain` equal to `package_total`
cpu_energy = { metric = "rapl_consumed_energy", resource_kind = "local_machine", domain = "package_total" }

# Timeseries related to the resource consumers.
[plugins.energy-attribution.formulas.attributed_energy_cpu.per_consumer]
# Defines the timeseries `cpu_usage` that is used in the formula, as the measurements points that have:
# - the metric `cpu_percent`
# - the attribute `kind` equal to `total`
cpu_usage = { metric = "cpu_percent", kind = "total" }
AMD GPU example
In this example, we define an attribution formula that produces a new metric attributed_energy_amd_gpu by combining amd_gpu_energy and amd_gpu_usage.
[plugins.energy-attribution.formulas.attributed_energy_amd_gpu]
# the expression used to compute the final value
expr = "amd_gpu_energy * amd_gpu_usage / 100.0"
# the time reference: this is a timeseries, defined by a metric (and other criteria, see below), that will not change during the transformation. Other timeseries can be interpolated in order to have the same timestamps before applying the formula.
ref = "amd_gpu_energy"

# Timeseries related to the resources.
[plugins.energy-attribution.formulas.attributed_energy_amd_gpu.per_resource]
# Defines the timeseries `amd_gpu_energy` that is used in the formula, as the measurement points that have:
# - the metric `amd_gpu_energy_consumption`
amd_gpu_energy = { metric = "amd_gpu_energy_consumption" }

# Timeseries related to the resource consumers.
[plugins.energy-attribution.formulas.attributed_energy_amd_gpu.per_consumer]
# Defines the timeseries `amd_gpu_usage` that is used in the formula, as the measurements points that have:
# - the metric `amd_gpu_process_compute_unit_occupancy`
amd_gpu_usage = { metric = "amd_gpu_process_compute_unit_occupancy" }
More information
Here is how the interpolation used by this plugin works. Given a reference timeseries and some other timeseries, it synchronizes all the timeseries by interpolating the non-reference points at the timestamps of the reference. The reference is left untouched.

Energy estimation TDP plugin
Introduction
This plugin estimate the energy consumption for pods based on the TDP value of the machine where pods are running. The TDP (Thermal Design Power) is the maximum amount of heat generated by a computer component. Refer to the wikipedia page of TDP for more details.
In the first version of the plugin, we consider only the TDP of the CPU.
This plugin requires the cgroupv2 input plugin (k8s) as it needs the input measurements of cgroups v2.
The estimation calculation is done using the following formula:
$$\Large Energy=\frac{cgroupv2cpu total usagenb_vcpuTDP}{10^6pooling_interval*nb_cpu}$$
cgroupv2_cpu_total_usage: total usage of CPU in micro seconds for a podnb_vcpu: number of virtual CPU of the hosting machine where pod is runningnb_cpu: number of physical CPU of the hosting machine where pod is runningpolling_interval: polling interval of cgroupv2 input plugin
Energy estimation tdp plugin
The binary created by the compilation will be found under the target repository.
Prepare your environment
To work this plugin needs k8s plugin configured, so the needed things are related to k8s plugin requirements:
- cgroup v2
- kubectl
- alumet-reader user
Configuration
[plugins.EnergyEstimationTdpPlugin]
poll_interval = "30s"
tdp = 100.0
nb_vcpu = 1.0
nb_cpu = 1.0
pool_interval: must be identical to the poll_interval of input k8s plugin. Default value is 1s.nb_vcpu: number of virtual cpu allocated to the virtual machine in case of kubernetes nodes are virtual machine. Using the kubectl get node command, you can retrieve the number of virtual cores. If the kubernetes nodes are physical machine, assign it to value 1. Default value is 1.
To get the CPU capacity of a kubernetes node, execute the following command:
kubectl  describe node <node name> | grep cpu -B 2
  Hostname:    <node name>
Capacity:
  cpu:                32
nb_cpu: number of physical cpu of the hosted machine. Using thelscpuorhwinfo, you can retrieve the number of cpu. If the kubernetes nodes are physical machine, assign it to value 1. Default value is 1.
tdp: Thermal Design power; each CPU has a calculated thermal design value; the value can be find on internet (usually on CPU manufacturer); you need the exact CPU family (using command lscpu or hwinfo). For example, for Intel® Xeon® D Processor, family D-2183IT, the tpd can be found it’s intel documentation page
tdp value is 100W.
Default value is 100.
Process to Cgroup Bridge Plugin
The Process to Cgroup Bridge plugin creates an Alumet transform that will take as input measurements with a ResourceConsumer::Process and transform it to ResourceConsumer::ControlGroup using procfs to bridge the process id to the related cgroup.
It’s designed to be coupled with another Alumet source that produce process measurements (eg: plugin-nvidia-nvml).
The Configuration allows to make the transformation step only on some selected metrics.
Requirements
- A source plugin that produces measurements with ResourceConsumer::Process
Configuration
Here is a configuration example of the Process to Cgroup Bridge Plugin. It’s part of the Alumet configuration file (eg: alumet-config.toml).
[plugins.process-to-cgroup-bridge]
# The metrics names we want to find the cgroup for
processes_metrics = [
    "some_metric_to_bridge",
    "another_metric_to_bridge",
]
# Will aggregate measurements in case multiple processes share the same cgroup and have the same timestamp. This leads to one measurement per metric per cgroup per timestamp.
merge_similar_cgroups = true
# Will keep all the measurements that have been processed by the transformer. In case it's false only the measurements with a cgroup resource consumer will be kept.
keep_processed_measurements = true
More informations
Cgroup not found
In case the transform plugin doesn’t find a cgroup for a process measurement, it will silently skip the transformation step for this measurement.
Cgroup v1
The plugin currently does not handle processes managed by cgroup v1 correctly. If a process is associated with multiple cgroups (that’s the case in cgroup v1), the plugin will arbitrarily select one from the list found in the /proc/[pid]/cgroup file.
Measurement Outputs
Measurement outputs store the measurements or send them elsewhere.
To store/send the measurements where you want, you should enable the relevant plugins. This section documents the plugins that provide outputs.
Outputs in the pipeline
After all the transforms have processed a batch of measurements, it is given to the outputs.
Multiple outputs can be enabled at the same time. Each output sees the same data.
CSV plugin
Provides an output to CSV.
Requirements
- Write permissions to the csv file
Configuration
Here is an example of how to configure this plugin.
Put the following in the configuration file of the Alumet agent (usually alumet-config.toml)
[plugins.csv]
# Absolute or relative path to the output_file
output_path = "alumet-output.csv"
# Do we flush after each write (measurements)?
force_flush = true
# Do we append the unit (unique name) to the metric name?
append_unit_to_metric_name = true
# Do we use the unit display name (instead of its unique name)?
use_unit_display_name = true
# The CSV delimiter, such as `;`
csv_delimiter = ";"
More information
Format of the output file
| metric | timestamp | value | resource_kind | resource_id | consumer_kind | consumer_id | (attribute_1) | (…) | __late_attributes |
|---|---|---|---|---|---|---|---|---|---|
| Metric in format {metric_name}_{unit} See Example | Time in format rfc3339 | The measured value | See Enum Resource | See Enum Resource | See Enum ResourceConsumer | See Enum ResourceConsumer | Additional attributes for the metric | One per column | Additional attributes in format {name}={value} |
See MeasurementPoint for more details
Example metric format
The optional unit is in the form of its unique name or displaying name as specified by the Unified Code for Units of Measure (UCUM).
memory_usage(metric name no unit)memory_usage_B(metric name and unit as display_name)memory_usage_By(metric name and unit as unique_name)
Output example with late_attributes
The late_attributes is used for attributes that arrive to the CSV output after the header has already been written to the file.
metric,timestamp,value,resource_kind,resource_id,consumer_kind,consumer_id,__late_attributes
cpu_time_delta_nanos,2025-01-01T12:00:00.000000000Z,1720000000,local_machine,,process,15,kind=user
Output example with additional attributes
metric,timestamp,value,resource_kind,resource_id,consumer_kind,consumer_id,name,namespace,node,uid,__late_attributes
cpu_time_delta_nanos,2025-01-01T12:00:00.000000000Z,1720000000,local_machine,,cgroup,kubepods.slice/kubepods-besteffort.slice/kubepods-besteffort-pod00b506dc-87ee-462c-880d-3e41d0dacd0c.slice,pod1,default,test-node,00b506dc-87ee-462c-880d-3e41d0dacd0c,,
ElasticSearch / OpenSearch plugin
The elasticsearch plugin inserts Alumet measurements into ElasticSearch or OpenSearch (the API that we use is identical in both projects).
Requirements
- Write access to an ElasticSearch or Opensearch instance
Configuration
Here is an example of how to configure this plugin.
Put the following in the configuration file of the Alumet agent (usually alumet-config.toml).
[plugins.elasticsearch]
# The url of the database instance.
server_url = "http://localhost:9200"
# Controls the use of certificate validation and hostname verification.
# You should think very carefully before you use this!
allow_insecure = false
# The prefix added to each index (format `{index_prefix}-{metric_name}`).
index_prefix = "alumet"
# Controls the use of an optional suffix for each index (format `{index_prefix}-{metric_name}-{metric_unit_unique_name}`).
metric_unit_as_index_suffix = false

[plugins.elasticsearch.auth.basic]
# Authentication Settings: Credentials in the config (Basic auth)
user = "TODO"
password = "TODO"
Authentication
Multiple auth schemes are supported.
Basic auth
You can give the username and password in the config:
[plugins.elasticsearch.auth.basic]
# Authentication Settings: Credentials in the config (Basic auth)
user = "TODO"
password = "TODO"
Or ask the plugin to read them from a file, which must contain the username and password separated by a colon (:):
[plugins.elasticsearch.auth.basic_file]
# Authentication Settings: Credentials in another file (Basic auth)
file = "basic_auth.txt"
Example file basic_auth.txt:
user:password
API key auth
[plugins.elasticsearch.auth.api_key]
# Authentication Settings: Credentials in the config (API key auth)
key = "your key here"
Bearer auth
[plugins.elasticsearch.auth.bearer]
# Authentication Settings: Credentials in the config (Bearer auth)
token = "your token here"
More information
The elasticsearch plugin inserts Alumet measurements by generating an index in the database for each metric in format {index_prefix}-{metric_name} or {index_prefix}-{metric_name}-{metric_unit_unique_name} if configured so.
See index basics.
Output Example
Here is the json representation for a MeasurementPoint for the metric kernel_cpu_time inside the database:
{
  "_index": "alumet-kernel_cpu_time",
  "_id": "gmyozJgBNhZm2PkkYwJ8",
  "_version": 1,
  "_score": 1,
  "fields": {
    "cpu_state": [
      "user"
    ],
    "consumer_id": [
      ""
    ],
    "@timestamp": [
      "2025-01-01T12:00:00.000000000Z"
    ],
    "cpu_state.keyword": [
      "user"
    ],
    "resource_id": [
      ""
    ],
    "resource_kind": [
      "local_machine"
    ],
    "consumer_kind": [
      "local_machine"
    ],
    "value": [
      1420
    ]
  }
}
See MeasurementPoint for more details.
InfluxDB plugin
Provides an output to InfluxDB v2.
Requirements
- Write access to a running instance of InfluxDB v2.
Configuration
Here is an example of how to configure this plugin. Put the following in the configuration file of the Alumet agent (usually alumet-config.toml).
[plugins.influxdb]
# Address of the host where InfluxDB is running
host = "http://localhost:8086"
# Token to write on the database
token = "FILL ME"
# Organisation where to write data
org = "FILL ME"
# Bucket where to write data
bucket = "FILL ME"
# By default, serialize all Alumet attributes as fields. This can be either "field" or "tag".
attributes_as = "field"
# Always serialize the given list of attributes as InfluxDB tags
attributes_as_tags = [""]
# Always serialize the given list of attributes as InfluxDB fields
attributes_as_fields = [""]
More information
Attribute serialization
InfluxDB does not have “attributes”, but “tags” (which are indexed and can only hold strings) and “fields” (which are not indexed and can hold strings, integers, floats and booleans). For tags, Alumet will automatically serialize the values to strings.
By changing the config options, you can choose which attributes translate to tags and which ones translate to fields.
For example, depending on the config, the same alumet point will lead to a different influxdb point. Here are some examples.
Let us take the following Alumet measurement point, and see how it is translated to an record.
#![allow(unused)]
fn main() {
MeasurementPoint {
    metric: rapl_consumed_energy,
    timestamp: 1755604520429334196,
    value: 123u,
    resource: Resource::CpuPackage { id: 0 },
    consumer: ResourceConsumer::local_machine,
    attributes: {
        domain: "package"
    }
}
}
Example with configuration 1
Serialize all Alumet attributes as fields, here there is domain.
[plugins.influxdb]
# ... <- other entries here (omitted)

# By default, serialize all attributes as fields.
attributes_as = "field"
This leads to the following line protocol for influx:
# <measurement>[,<tag_key>=<tag_value>[,<tag_key>=<tag_value>]] <field_key>=<field_value>[,<field_key>=<field_value>] [<timestamp>]
rapl_consumed_energy_J,resource_kind=cpu_package,resource_id=0,resource_consumer_kind=local_machine domain="package",value=123u 1755604520429334196
Example with configuration 2
Serialize all Alumet attributes as fields except domain, here there is no attribute concerned.
[plugins.influxdb]
# ... <- other entries here (omitted)

# By default, serialize all attributes as fields.
attributes_as = "field"
# Except for these attributes, which will become tags.
attributes_as_tags = ["domain"]
This leads to the following line protocol for influx:
# <measurement>[,<tag_key>=<tag_value>[,<tag_key>=<tag_value>]] <field_key>=<field_value>[,<field_key>=<field_value>] [<timestamp>]
rapl_consumed_energy_J,resource_kind=cpu_package,resource_id=0,resource_consumer_kind=local_machine,domain=package value=123u 1755604520429334196
Example with configuration 3
Serialize all Alumet attributes as tag except domain, here there is no attribute concerned.
[plugins.influxdb]
# ... <- other entries here (omitted)

# By default, serialize all attributes as tags.
attributes_as = "tag"
# Except for these attributes, which will become fields.
attributes_as_fields = ["domain"]
This leads to the following line protocol for influx:
# <measurement>[,<tag_key>=<tag_value>[,<tag_key>=<tag_value>]] <field_key>=<field_value>[,<field_key>=<field_value>] [<timestamp>]
rapl_consumed_energy_J,resource_kind=cpu_package,resource_id=0,resource_consumer_kind=local_machine domain="package",value=123u 1755604520429334196
About the Line Protocol
You can learn more about the line protocol used in InfluxDB v2 on this web page
Kwollect plugin
The kwollect plugin pushes data to a Kwollect API.
In particular, it allows users of the Grid’5000 testbed to easily visualize the measurements obtained by Alumet, alongside other measurements provided by, for instance, wattmeters.
Requirements
You need access to the Kwollect API.
If you are running a job on Grid’5000, you already have this access.
Configuration
Here is a configuration example of the kwollect plugin. It’s part of the Alumet configuration file (eg: alumet-config.toml).
[plugins.kwollect]
# Url of the Grid'5000 API, it needs to specify the correct site (here 'grenoble')
url = "https://api.grid5000.fr/stable/sites/grenoble/metrics"
# Name of the machine
hostname = "mars"
# Login and password used to push the metric, both are optional. If none are specified, it will push using the current user
# login = ""
# password = ""
On Grid’5000, you can simply generate this configuration (see below).
How to use in a Grid’5000 job
Here is a quick guide to send Alumet measurements to Kwollect.
- Start a job with
oarsub. - Automatically generate the configuration corresponding to your node:
alumet-agent --plugins rapl,kwollect   config regen
# add other plugins here as needed ^^^
You don’t need to setup a login and password.
- Start the Alumet agent to collect measurements.
- Wait some time (usually < 1min).
- Visualize the measurements by opening the dashboard at
https://api.grid5000.fr/stable/sites/{SITE}/metrics/dashboard. For instance, if your node is in Lyon, go to https://api.grid5000.fr/stable/sites/lyon/metrics/dashboard. - Select your node and the metrics you want (such as
rapl_consumed_energy) on Grafana.
MongoDB plugin
Provides an output to MongoDB.
Requirements
- A running instance of MongoDb, with version >= 4.0.
Configuration
Here is an example of how to configure this plugin.
Put the following in the configuration file of the Alumet agent (usually alumet-config.toml).
[plugins.mongodb]
# Address of the host where MongoDB is running
host = "localhost"
# Port used by MongoDB
port = 27017
# Name of the database to use
database = "Belgium"
# Name of the collection within the database
collection = "Books"
# Username and password for authentication purpose
username = "Amelie"
password = "Nothomb"
More information
About attributes, they’re all translated into MongoDB fields; if their name is a reserved one, it’s formatted as name_field.
Here is a example of an MongoDB entry:
{
  "_id": {
    "$oid": "68936f09bfb52feb9d640710"
  },
  "measurement": "cpu_time_delta",
  "resource_kind": "local_machine",
  "resource_id": "5",
  "resource_consumer_kind": "process",
  "resource_consumer_id": "25599",
  "kind": "guest",
  "value": "0u",
  "timestamp": "1754492679656310160",
  "measurement_field": "cpu_time_delta_field"
}
In the above example, there is a measurement attribute, as it’s name is a reserved one, it’s translated into measurement_field.
The mandatory field measurement don’t change.
OpenTelemetry plugin
OpenTelemetry (OTEL) is an open source observability framework and toolset designed to ease the integration of observability backends such as Jaeger, Prometheus, Elasticsearch, OpenSearch and more. While it offers vendor/tool-agnostic and auto-instrumentation capabilities, the backend (storage) and the frontend (visualization) of telemetry data are intentionally left to other tools.
The opentelemetry plugin for Alumet is a push-based exporter (via gRPC), which can be connected to an OpenTelemetry Collector (via a receiver), processed in any way, and then exported to a observability backend like Jaeger, Prometheus, Thanos, OpenSearch, ElasticSearch, etc.
Requirements
You need to have an OTEL Collector reachable.
Configuration
Here is an example of how to configure this plugin.
Put the following in the configuration file of the Alumet agent (usually alumet-config.toml).
[plugins.opentelemetry]
# Where to send the data
collector_host = "http://localhost:4317"
# How often to send the data
push_interval_seconds = 15

# Which metric name to use when sending the data.
# You can prepend a prefix and append a suffix to the name of Alumet metrics.
prefix = ""
suffix = "_alumet"
# Use the display name of the units instead of their unique name, as specified by the UCUM.
# See https://ucum.org/ucum for a list of unit and their symbols.
use_unit_display_name = true
add_attributes_to_labels = true
Examples
The plugin has been tested on both, local environment using docker-compose.yaml and a K8s.
OpenSearch local example
OpenSearch is a distributed search and analytics engine that can be used as vector database, full-text search and observability backend for logs, metrics and traces.
The connection to OpenSearch was done following the official Data Prepper tutorial which is an additional tool that translates OTEL protocol to OpenSearch protocol, as described on the OpenSearch blog.
Notes:
- For clarity, I disconnected traces and metrics from other sources to better visualize in OpenSearch what comes from alumet.
- Also, the “logging” exporter is deprecated and needs to be updated.
# data-prepper/examples/metrics-ingestion-otel/otel-collector-config.yml
receivers:
  # hostmetrics:
  #   collection_interval: 60s
  #   scrapers:
  #     cpu:
  #     memory:
  # prometheus:
  #   config:
  #     scrape_configs:
  #       - job_name: data-prepper
  #         metrics_path: /metrics/sys
  #         scrape_interval: 60s
  #         static_configs:
  #           - targets: ['data-prepper:4900']
  otlp:
    protocols:
      grpc:
        endpoint: 0.0.0.0:4317

exporters:
  debug: # Appears as "logging" but is deprecated
    verbosity: detailed
Alumet was left with the default configuration and resulted in the correct population of the OpenSearch database and ability to explore the data via the dashboards as shown in the figure below.
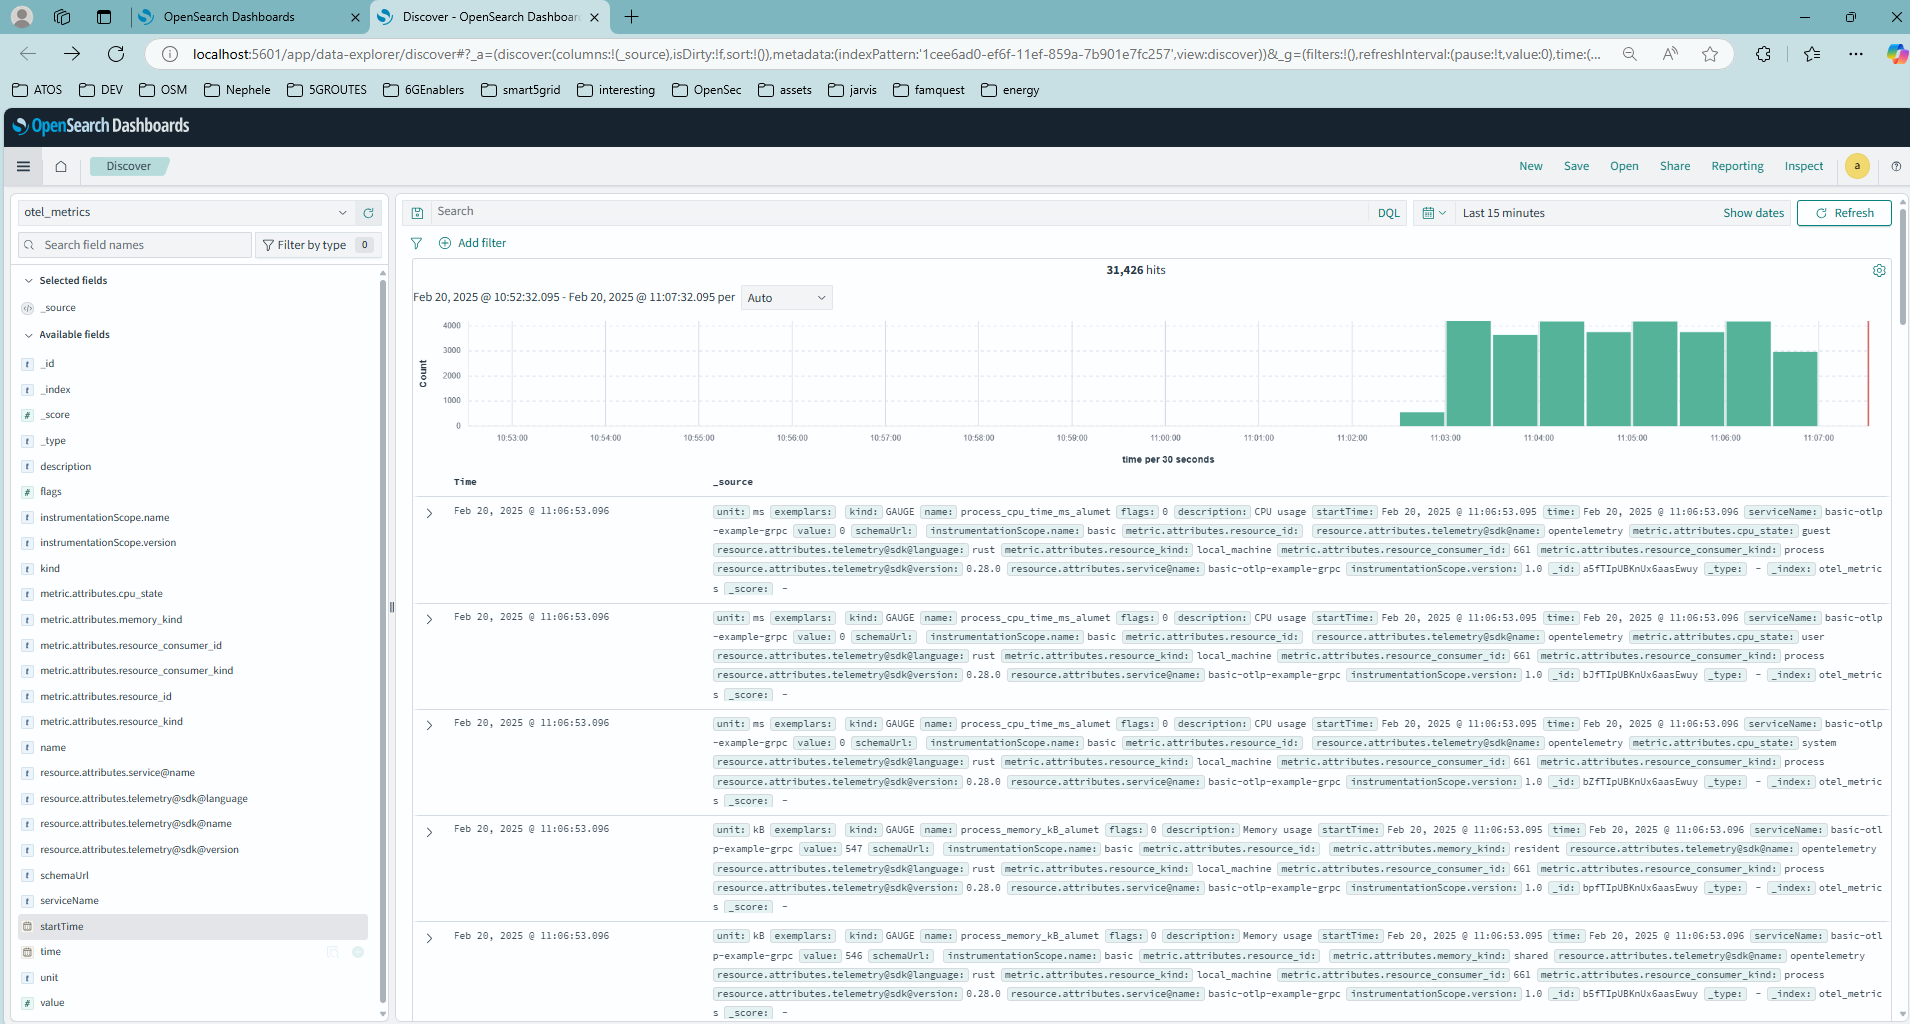
Thanos K8s example
Thanos is a set of components that can be composed into a highly available metric system with unlimited storage capacity for Time Series Data Base (TSDB), which can be added seamlessly on top of existing Prometheus deployments. The component “Thanos Receive” has the Prometheus Remote Write API built in, on top of the functionality for long-term-storage and downsampling. Since the OTEL Exporter natively implements the Prometheus Remote Write protocol, it can directly upload TSDB blocks to the object storage bucket of Thanos even without an underlying Prometheus.
Alumet was configured as following and deployed in the host of a single-node K8s cluster which had an OTEL collector using the operator and Thanos.
# Alumet config
[plugins.opentelemetry]
collector_host = "http://my-otel-collector-exposed-service"
prefix = ""
suffix = "_alumet"
append_unit_to_metric_name = true
use_unit_display_name = true
add_attributes_to_labels = true
push_interval_seconds = 15
# Otel values.yaml
# Top level field related to the OpenTelemetry Operator
opentelemetry-operator:
  # Field indicating whether the operator is enabled or not
  enabled: true
  manager:
    collectorImage:
      repository: otel/opentelemetry-collector-contrib
  # Sub-field for admission webhooks configuration
  admissionWebhooks:
    # Use Helm to automatically generate self-signed certificate.
    certManager:
      enabled: false
    autoGenerateCert:
      enabled: true
collectors:
  otelgateway:
    suffix: gateway
    replicas: 1
    mode: deployment
    enabled: true
    config:
      receivers:
        otlp:
          protocols:
            grpc:
              endpoint: 0.0.0.0:4317
      processors:
        batch:
          send_batch_size: 1024
          timeout: 1s
      exporters:
        prometheusremotewrite:
          endpoint: "http://my-thanos-receive-service.monitoring.svc.cluster.local:19291/api/v1/receive"

      service:
        pipelines:
          metrics:
            receivers:
              - otlp
            processors:
              - batch
            exporters:
              - prometheusremotewrite
With this setup, we can see the real-time measurements made by Alumet in Thanos:
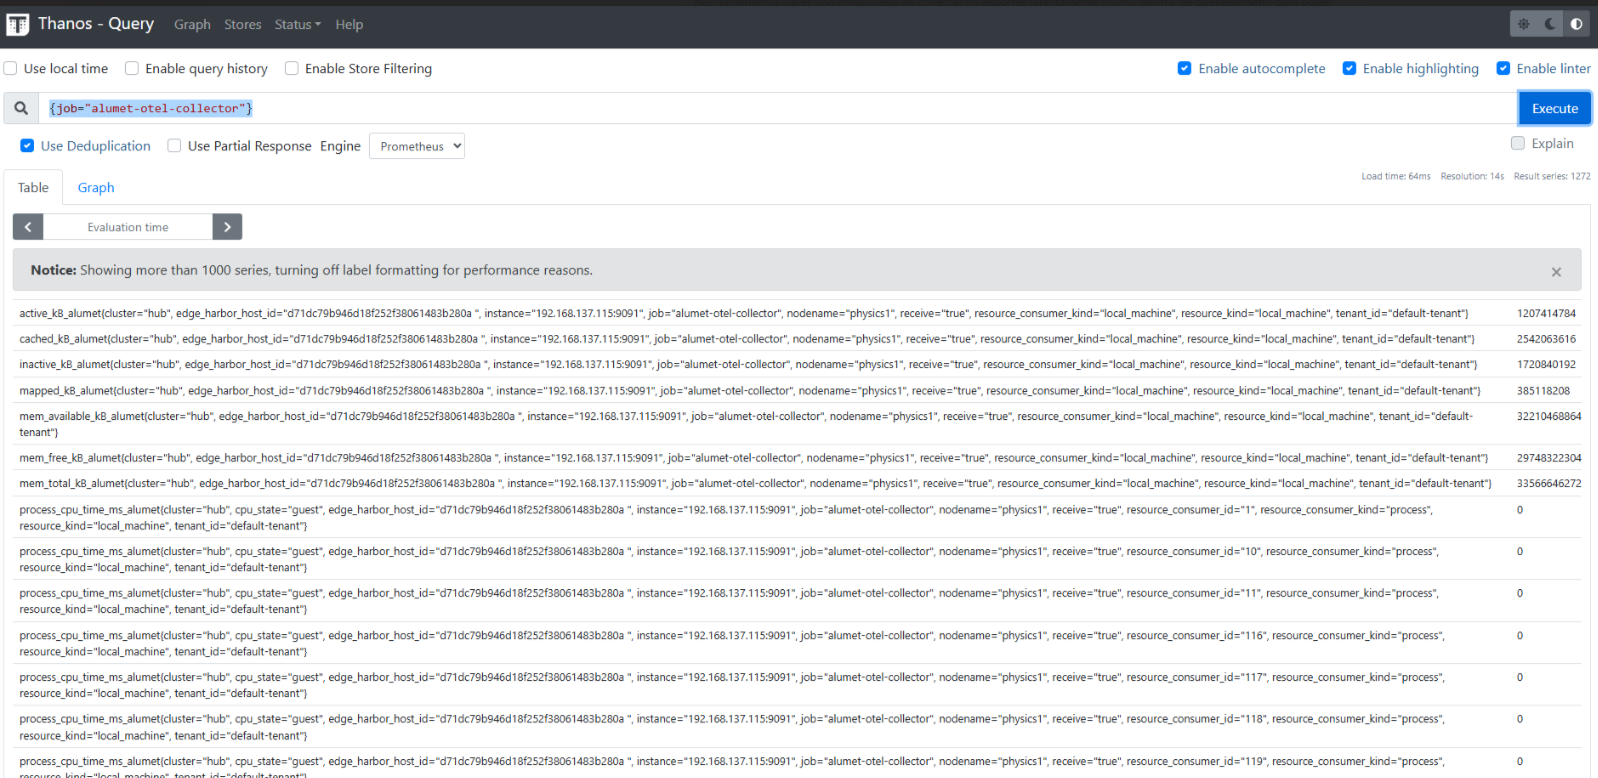
Prometheus Exporter plugin
Prometheus is an open source system for monitoring and alerting based on the collection (pull-based) of metrics in a Time Series Data Base (TSDB).
The prometheus-exporter plugin is standard Prometheus exporter, which is exposed as a web service (with endpoint /metrics) to be reached by the Prometheus system to pull the Alumet’s metrics.
Requirements
For this plugin to work, you first need to deploy Prometheus. See some examples below.
Configuration
Here is an example of how to configure this plugin.
Put the following in the configuration file of the Alumet agent (usually alumet-config.toml).
[plugins.prometheus-exporter]
host = "0.0.0.0"
prefix = ""
suffix = "_alumet"
port = 9091
append_unit_to_metric_name = true
use_unit_display_name = true
add_attributes_to_labels = true
Examples
The plugin has been tested on both a local environment and a K8S cluster.
Testing Locally
The plugin can be tested in a local environment with the Alumet’s default configuration for it and results in the ability of downloading the metrics from http://localhost:9091/metrics.
Note that the list of metrics available will vary based on the input plugins used.
Show an excerpt of what the metrics endpoint returns
# HELP mem_total_kB_alumet ?.
# TYPE mem_total_kB_alumet gauge
mem_total_kB_alumet{resource_consumer_id="",resource_consumer_kind="local_machine",resource_id="",resource_kind="local_machine"} 12372303872.0
# HELP mem_free_kB_alumet ?.
# TYPE mem_free_kB_alumet gauge
mem_free_kB_alumet{resource_consumer_id="",resource_consumer_kind="local_machine",resource_id="",resource_kind="local_machine"} 1491062784.0
# HELP mem_available_kB_alumet ?.
# TYPE mem_available_kB_alumet gauge
mem_available_kB_alumet{resource_consumer_id="",resource_consumer_kind="local_machine",resource_id="",resource_kind="local_machine"} 5022056448.0
# HELP cached_kB_alumet ?.
# TYPE cached_kB_alumet gauge
cached_kB_alumet{resource_consumer_id="",resource_consumer_kind="local_machine",resource_id="",resource_kind="local_machine"} 3523051520.0
# HELP swap_cached_kB_alumet ?.
# TYPE swap_cached_kB_alumet gauge
swap_cached_kB_alumet{resource_consumer_id="",resource_consumer_kind="local_machine",resource_id="",resource_kind="local_machine"} 54939648.0
# HELP active_kB_alumet ?.
# TYPE active_kB_alumet gauge
active_kB_alumet{resource_consumer_id="",resource_consumer_kind="local_machine",resource_id="",resource_kind="local_machine"} 2447753216.0
# HELP inactive_kB_alumet ?.
# TYPE inactive_kB_alumet gauge
inactive_kB_alumet{resource_consumer_id="",resource_consumer_kind="local_machine",resource_id="",resource_kind="local_machine"} 7838990336.0
# HELP mapped_kB_alumet ?.
# TYPE mapped_kB_alumet gauge
mapped_kB_alumet{resource_consumer_id="",resource_consumer_kind="local_machine",resource_id="",resource_kind="local_machine"} 230359040.0
# HELP kernel_cpu_time_ms_alumet busy CPU time.
# TYPE kernel_cpu_time_ms_alumet gauge
kernel_cpu_time_ms_alumet{cpu_state="idle",resource_consumer_id="",resource_consumer_kind="local_machine",resource_id="11",resource_kind="cpu_core"} 4950.0
kernel_cpu_time_ms_alumet{cpu_state="steal",resource_consumer_id="",resource_consumer_kind="local_machine",resource_id="1",resource_kind="cpu_core"} 0.0
kernel_cpu_time_ms_alumet{cpu_state="idle",resource_consumer_id="",resource_consumer_kind="local_machine",resource_id="7",resource_kind="cpu_core"} 4900.0
[…]
# EOF
Running on K8S: Alumet + Prometheus + Grafana
For the K8s demo, Alumet was installed with the it’s default configuration in the host of a NUC where there was a single-node k3s cluster. After installing the default kube-prometheus-stack, the following manifest was deployed to scrape the exporter:
apiVersion: monitoring.coreos.com/v1alpha1
kind: ScrapeConfig
metadata:
  name: alumet-host-scrape
  labels:
    release: promstack
spec:
  staticConfigs:
    - labels:
        job: alumet-host
      targets:
        - my_host_ip:9091
We used the stress command to simulate some load on a compute node:
stress --cpu 8 --io 4 --vm 2 --vm-bytes 128M
This resulted in Grafana and Prometheus to correctly capture the behavior of the system, as shown in the figure below.
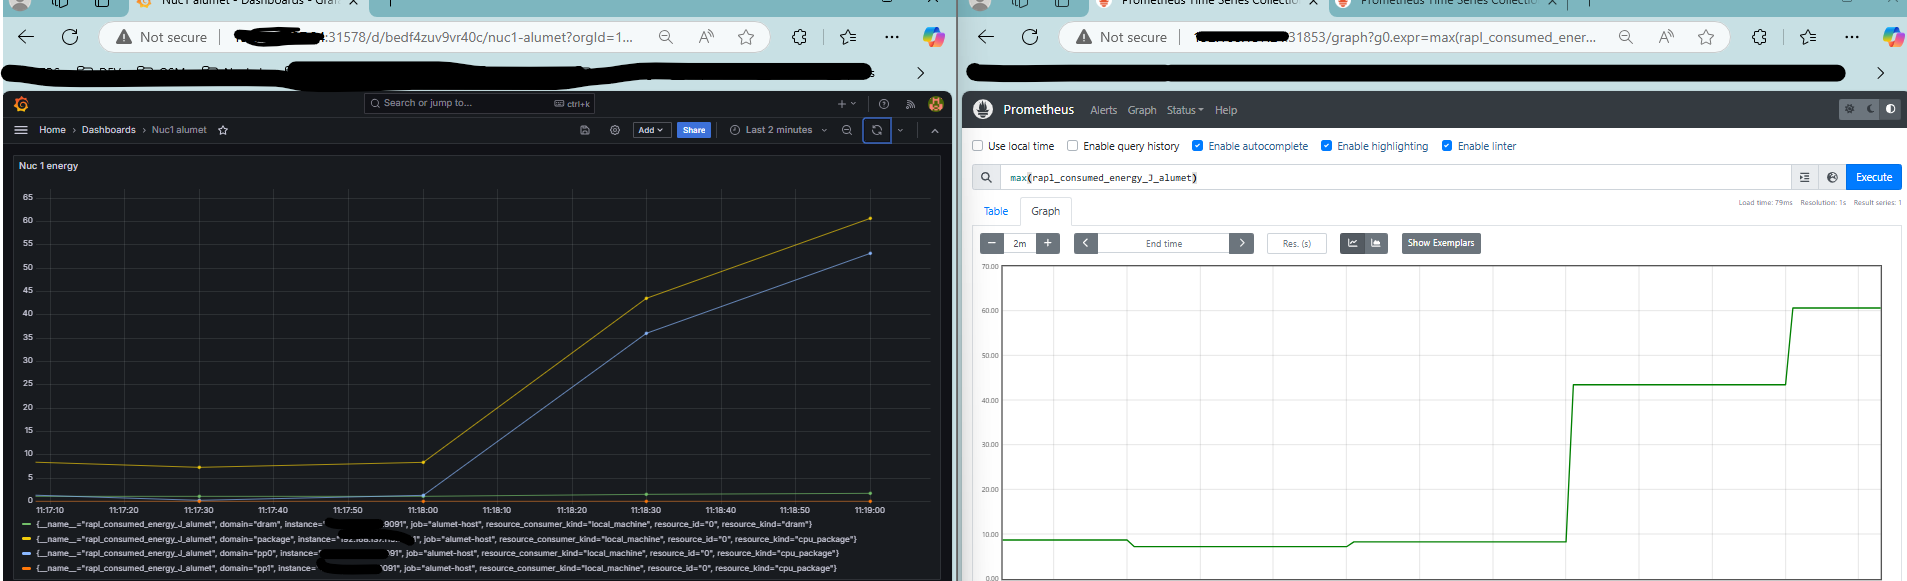
Special plugins
This section documents “special” plugins that do not fill well in another category, for one of two reasons:
- They do not provide any pipeline element (source, transform or output).
- They do provide pipeline elements, but must be used in a very special way.
Relay plugins
The relay plugins allow to send and receive measurements over the network, with an efficient protocol based on postcard binary serialization.
The relay is made of two parts:
relay-clientplugin: sends all measurements to the relay server. Usually, the client agent is configured with input and transform plugins.relay-serverplugin: receives measurements from one or multiple clients. Usually, the server agent is configured with an output plugin to write the measurements to a database.
Since the client and server are two separate plugins, they must be enabled and configured independently.
A possible configuration is to connect several clients to a single server, which is connected to a database, as illustrated below.
graph TD
A[Alumet client] --> B(Alumet server);
C[Metrics] --> A;
D[Alumet client] --> B(Alumet server);
E[Metrics] --> D;
F[Alumet client] --> B(Alumet server);
G[Metrics] --> F;
B[Alumet server] --> Z(database);
Requirements
At least, 2 alumet agents must be running: 1 client and 1 server.
Configuration
Client
Here is a configuration example of the plugin for the client. It’s part of the Alumet configuration file (eg: alumet-config.toml).
[plugins.relay-client]
# The name that this client will use to identify itself to the collector server.
# If not specified, defaults to the hostname.
client_name = "${NODE_NAME}" # here we use the environment variable NODE_NAME

# The host and port of the server, for instance `127.0.0.1:50051`.
relay_server = "192.168.1.10:50051"

# Maximum number of elements to keep in the output buffer before sending it.
buffer_max_length = 200

# Maximum amount of time to wait before sending the measurements to the server.
buffer_timeout = "30s"

# Parameter of the exponential backoff strategy that is applied when a network operation fails.
# The delay is multiplied by two after each attempt.
[plugins.relay-client.retry]
# Maximum number of retries before giving up.
max_times = 5
# Initial delay between two attempts.
initial_delay = "1s"
# Maximum delay between two attempts.
max_delay = "10s"
The durations follow the humantime format.
Server
Here is a configuration example of the plugin for the server. It’s part of the Alumet configuration file (eg: alumet-config.toml).
[plugins.relay-server]
# Address to listen on.
# The default value is "IPv6 any" on port 50051, i.e. `[::]:50051`.
# For information, ip6-localhost is `::1`.
# To listen on all your network interfaces, use `0.0.0.0` or `::` as the ip address.
address = "[::]:50051"
Command-line arguments
Client
With the standard Alumet agent, you can override the address/port of the relay client with the command-line option --relay-out. Example:
alumet-agent --relay-out 192.168.1.10:50051
Server
With the standard Alumet agent, you can override the address/port of the relay server with the command-line option --relay-in. Example:
alumet-agent --relay-in 0.0.0.0:50051
Socket Control plugin
This plugin allows to control the Alumet pipeline through a Unix socket (it could be extended to support other forms of communications).
Requirements
- Linux
- Alumet agent must “have write and search (execute) permission on the directory in which the socket is created” as stated in the
Pathname socket ownership and permissionschapter from the unix man pages.
Configuration
Here is an example of how to configure this plugin.
Put the following in the configuration file of the Alumet agent (usually alumet-config.toml).
[plugins.socket-control]
socket_path = "alumet-control.sock"
How to use
Once an alumet agent is running with the socket-control plugin loaded and enabled.
You can use the socket that is specified in the config file under the field socket_path.
To send a command through the socket to the agent, run:
echo "<command>" | socat UNIX-CONNECT:./alumet-control.sock -
Available commands
shutdownorstop: shutdowns the measurement pipelinecontrol <PATTERN> [ARGS...]: reconfigures a part of the pipeline (see below)
Control patterns
The pattern has three levels of specification and can use wildcards.
You can either use the first level or the three levels together.
It must match with the following format kind/plugin/element, where:
kindis the type of plugin that must be matched, it can be one of the three following: source, output or transformpluginis the name of the plugin that will be selected by the pattern, it can be “socket-control” for exampleelementis the name of the element created by the plugin that match with the pattern, it can be the source name for a source plugin for example
Here are some valid examples:
# Match everything in the pipeline of alumet

*
*/*/*

# Match every output

output
output/*/*

# Match all the transforms of a plugin

transform/plugin-energy-attribution/*

# Match a specific source of a source plugin

source/plugin-procfs/memory
Control arguments
The available options for control depend on the kind of element that the selector targets.
Options available on any element (sources, transforms and outputs):
pauseordisable: pauses a source, transform or outputresumeorenable: resumes a source, transform or output
Options available on sources and outputs (not transforms):
stop: stops and destroys the source or output
Options available on sources only:
set-period <Duration>: changes the time period between two measurements (only works if the source is a “managed” source)trigger-now: requests Alumet to poll the source (only works if the source enables manual trigger)