Monitoring an entire system
In this tutorial, you will learn how to install Alumet to monitor your system through an easy step-by-step guide.
Install Alumet
There are several ways of installing Alumet, you can use packages such as .rpm or .deb, you can install it using container image, there’s even a helm chart. But for now, let’s focus on package way using the installer provided in the Alumet repository.
curl -sSL https://raw.githubusercontent.com/alumet-dev/alumet/main/install.sh | bash
Your password could be asked.
See more on Installing Alumet chapter.
Important files
Once installed, let’s take a quick look at the files. The default configuration file of alumet can be found under: /etc/alumet/alumet-config.toml, you could add all needed plugins and their configuration.
Prepare the Configuration
In this tutorial, we will monitor our system. So let’s focus on the following plugins:
- Input plugins
- RAPL
- Procfs (system)
- Output plugins
- CSV
RAPL
This plugin collects measurements of processor energy usage. Also know as Running average power limit, follow the link to learn more on RAPL.
More information about the plugin on RAPL plugin’s README
Procfs
This plugin collects processes and system-related metrics on Linux based operating systems. Follow the link to learn more on Procfs. More information about the plugin on Procf plugin’s README
CSV
This plugin writes the measurements sent to Alumet in CSV format. More information about the plugin on CSV plugin’s README
The configuration
Alumet comes with a command to (re)generate the configuration. Let’s do this for the used plugins defining the needed configuration using:
alumet-agent --plugins rapl,procfs,csv --config my_config.toml config regen

If you want, you can disable some plugin, going under the config file and replacing (or adding): enabled = false wherever you want to disable the plugin. Like this:
[plugins.rapl]
enabled = false
poll_interval = "1s"
flush_interval = "5s"
no_perf_events  = false
Also, you can use the following configuration for an easy-start Alumet monitoring.
Show more
[plugins.rapl]
poll_interval = "5s"
flush_interval = "10s"
no_perf_events = false

[plugins.procfs.kernel]
enabled = true
poll_interval = "5s"

[plugins.procfs.memory]
enabled = false
poll_interval = "5s"
metrics = [
    "MemTotal",
    "MemFree",
    "MemAvailable",
    "Cached",
    "SwapCached",
    "Active",
    "Inactive",
    "Mapped",
]

[plugins.procfs.network]
enabled = false
poll_interval = "5s"

[plugins.procfs.processes]
enabled = true
refresh_interval = "2s"
strategy = "watcher"

[[plugins.procfs.processes.groups]]
exe_regex = ""
poll_interval = "2s"
flush_interval = "4s"
memory_mode = "quick"

[plugins.procfs.processes.events]
poll_interval = "1s"
flush_interval = "4s"
memory_mode = "quick"

[plugins.csv]
output_path = "alumet-output.csv"
force_flush = true
append_unit_to_metric_name = true
use_unit_display_name = true
csv_delimiter = ";"
csv_late_delimiter = ","
Learn more about configuration file on the Configuration file chapter.
Run Alumet
Once your configuration is done, it’s time to run Alumet.
To start Alumet with previously generated configuration file, use
alumet-agent --config my_config.toml
On my side, here is the launch of Alumet.
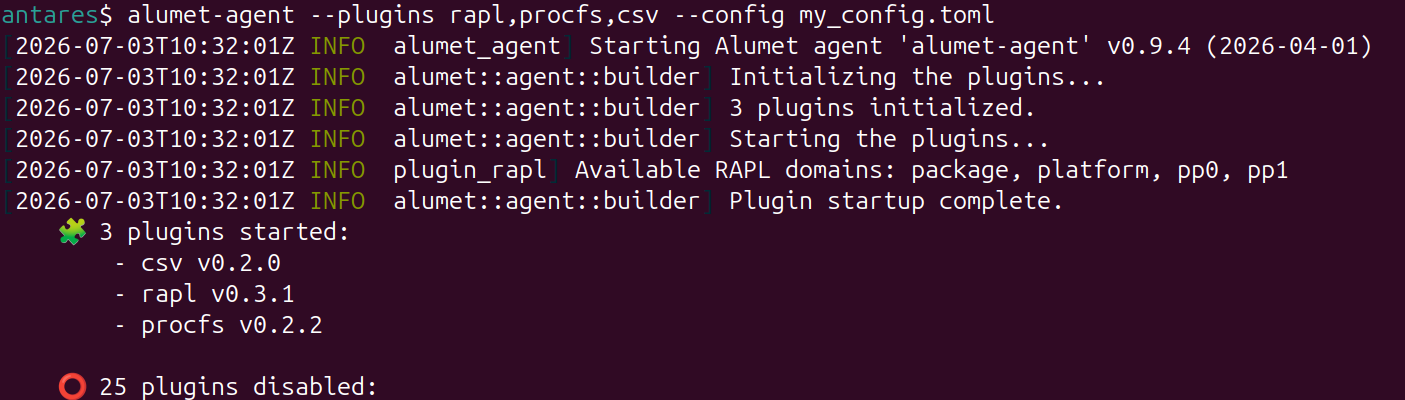
to
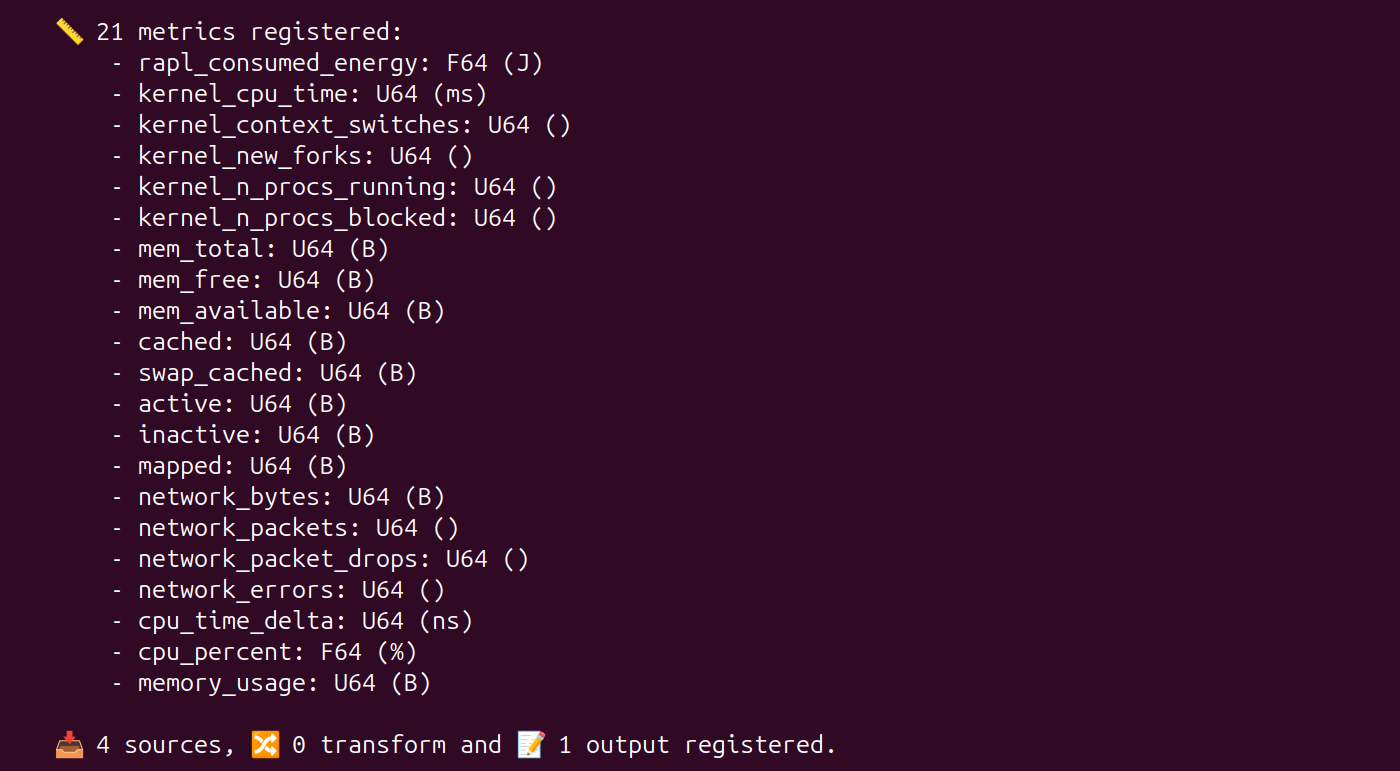
Here you can see that I enabled 3 plugins, 2 were input one and 1 is output.
Hit ctrl+c to stop Alumet and the measures.
Look for the results
Once Alumet is stopped, you can have a look to the created file in current directory: alumet-output.csv. The name and path were defined in the configuration file. You can search for output_path parameter in the alumet-config.toml of the current directory. And so you have your csv file containing all retrieved measures. You can freely use whatever you want to read this csv, basic file editor will be able to open it, but some will let you sort, filter,… contained lines.
Learn more
CSV is a very simple output but it could not be adapted for larger data gathering. You could look at the Influxdb plugins for a better adapted plugin.
And for a deeper tutorial, please have a look at the Deeper system monitoring with Alumet chapter (Upcoming one), which show more options for monitoring your system.