OpenTelemetry plugin
OpenTelemetry (OTEL) is an open source observability framework and toolset designed to ease the integration of observability backends such as Jaeger, Prometheus, Elasticsearch, OpenSearch and more. While it offers vendor/tool-agnostic and auto-instrumentation capabilities, the backend (storage) and the frontend (visualization) of telemetry data are intentionally left to other tools.
The opentelemetry plugin for Alumet is a push-based exporter (via gRPC), which can be connected to an OpenTelemetry Collector (via a receiver), processed in any way, and then exported to a observability backend like Jaeger, Prometheus, Thanos, OpenSearch, ElasticSearch, etc.
Requirements
You need to have an OTEL Collector reachable.
Configuration
Here is an example of how to configure this plugin.
Put the following in the configuration file of the Alumet agent (usually alumet-config.toml).
[plugins.opentelemetry]
# Where to send the data
collector_host = "http://localhost:4317"
# How often to send the data
push_interval_seconds = 15

# Which metric name to use when sending the data.
# You can prepend a prefix and append a suffix to the name of Alumet metrics.
prefix = ""
suffix = "_alumet"
# Use the display name of the units instead of their unique name, as specified by the UCUM.
# See https://ucum.org/ucum for a list of unit and their symbols.
use_unit_display_name = true
add_attributes_to_labels = true
Examples
The plugin has been tested on both, local environment using docker-compose.yaml and a K8s.
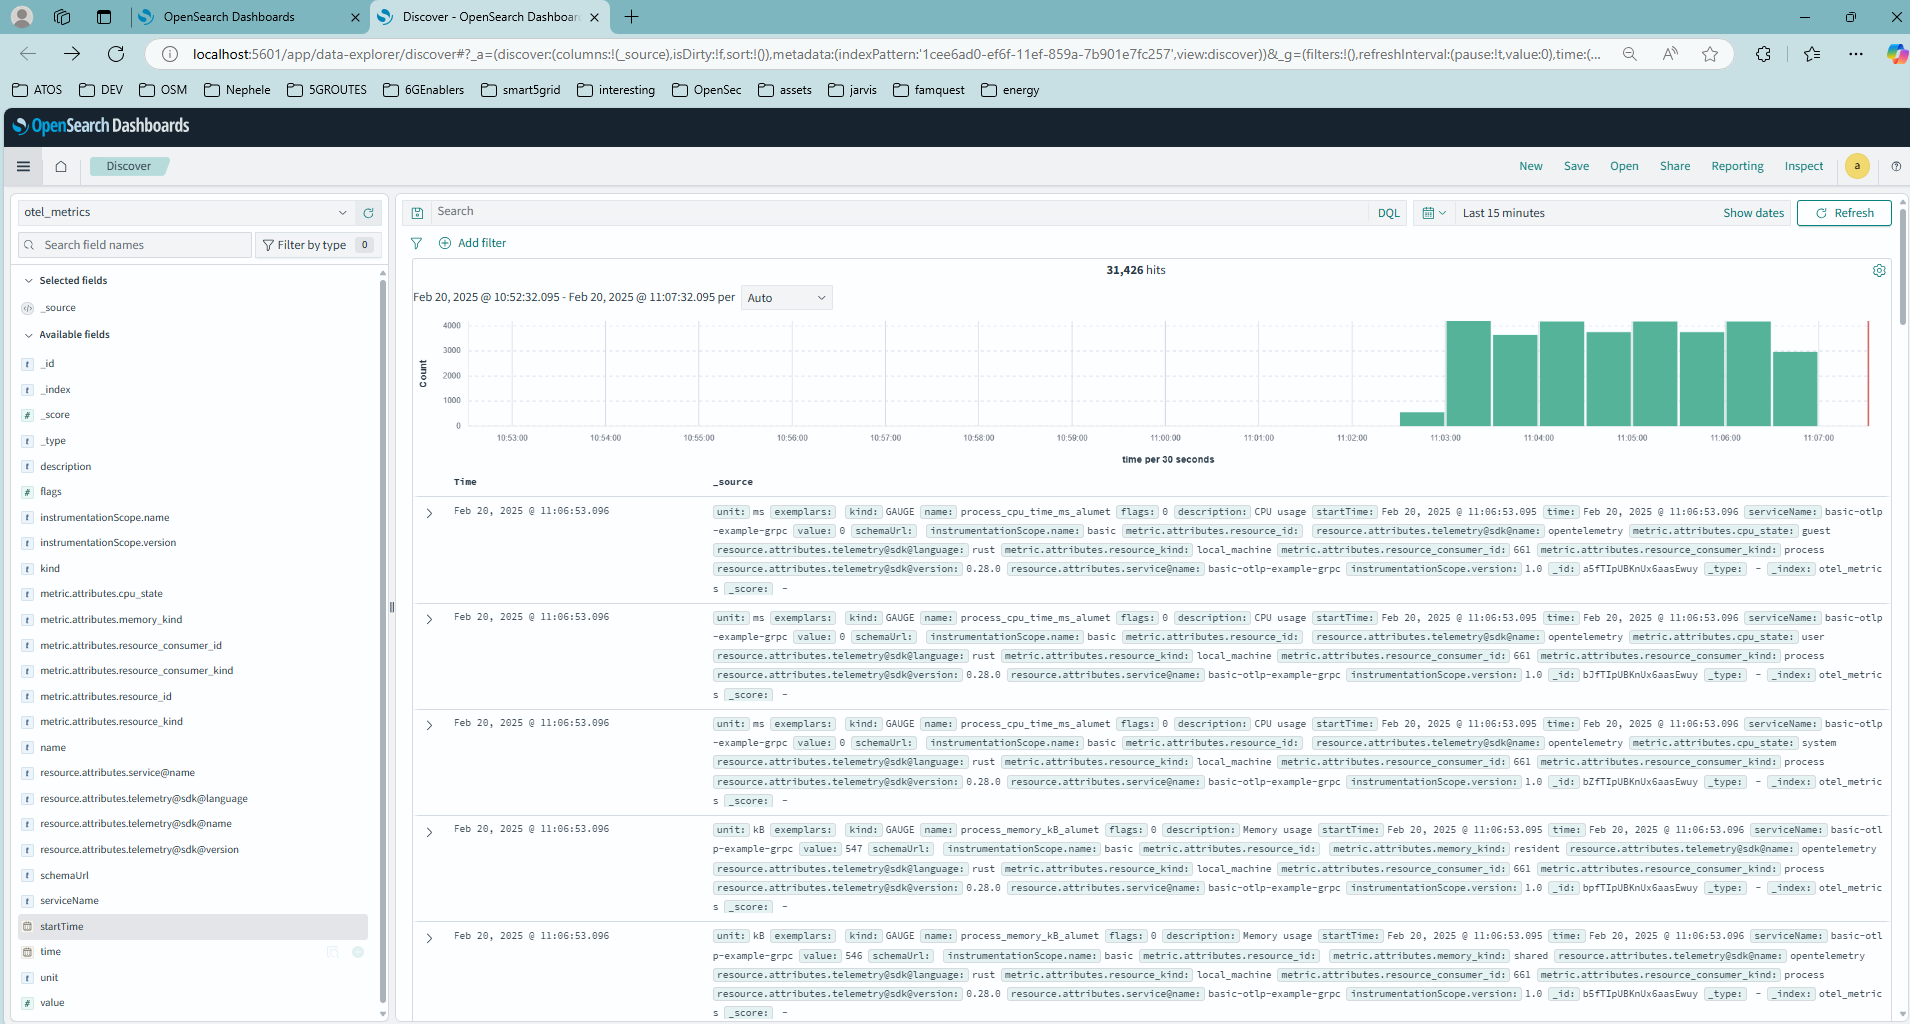
OpenSearch local example
OpenSearch is a distributed search and analytics engine that can be used as vector database, full-text search and observability backend for logs, metrics and traces.
The connection to OpenSearch was done following the official Data Prepper tutorial which is an additional tool that translates OTEL protocol to OpenSearch protocol, as described on the OpenSearch blog.
Notes:
- For clarity, I disconnected traces and metrics from other sources to better visualize in OpenSearch what comes from alumet.
- Also, the “logging” exporter is deprecated and needs to be updated.
# data-prepper/examples/metrics-ingestion-otel/otel-collector-config.yml
receivers:
  # hostmetrics:
  #   collection_interval: 60s
  #   scrapers:
  #     cpu:
  #     memory:
  # prometheus:
  #   config:
  #     scrape_configs:
  #       - job_name: data-prepper
  #         metrics_path: /metrics/sys
  #         scrape_interval: 60s
  #         static_configs:
  #           - targets: ['data-prepper:4900']
  otlp:
    protocols:
      grpc:
        endpoint: 0.0.0.0:4317

exporters:
  debug: # Appears as "logging" but is deprecated
    verbosity: detailed
Alumet was left with the default configuration and resulted in the correct population of the OpenSearch database and ability to explore the data via the dashboards as shown in the figure below.
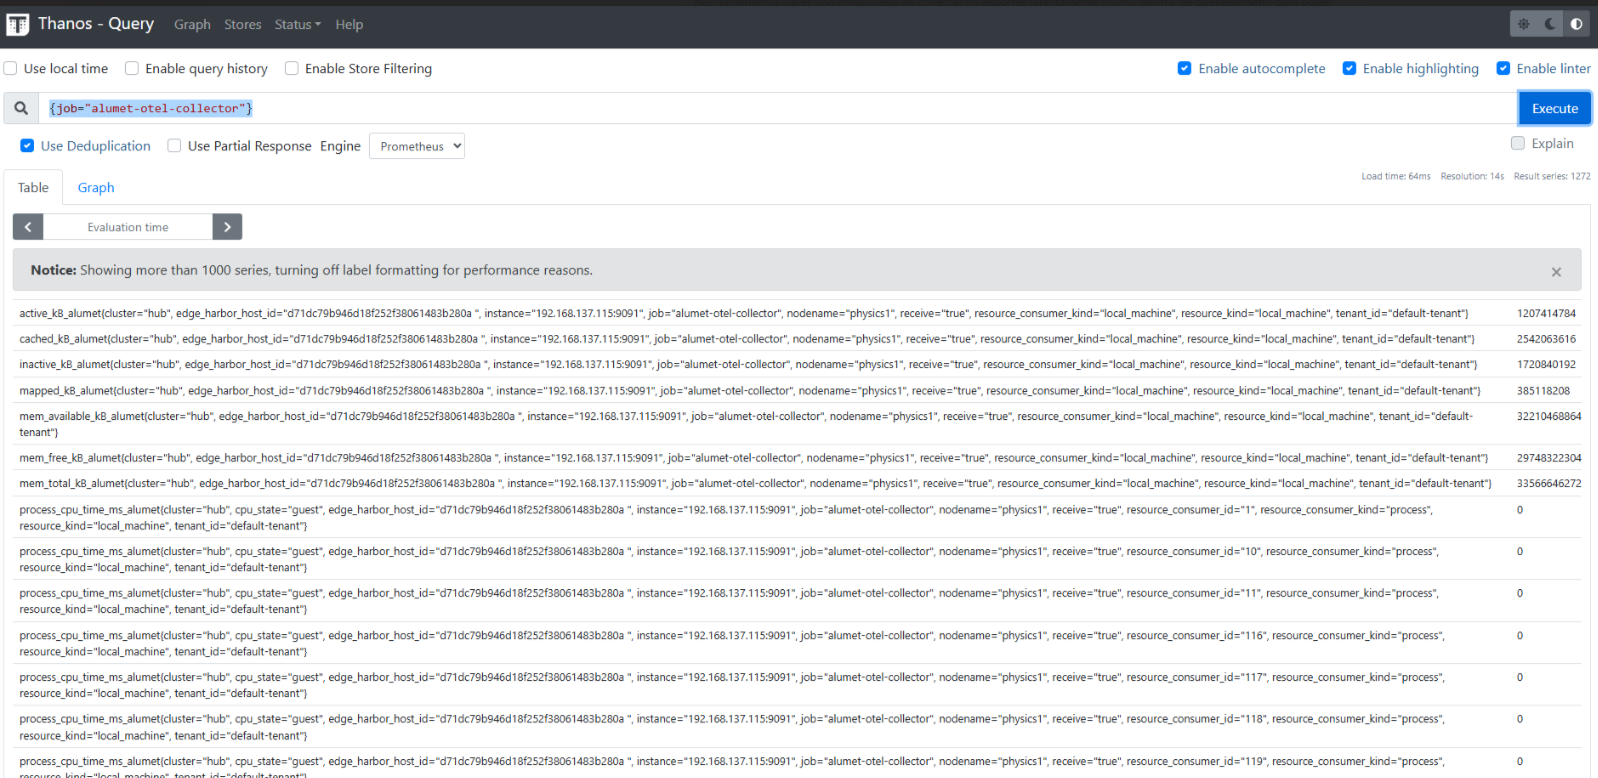
Thanos K8s example
Thanos is a set of components that can be composed into a highly available metric system with unlimited storage capacity for Time Series Data Base (TSDB), which can be added seamlessly on top of existing Prometheus deployments. The component “Thanos Receive” has the Prometheus Remote Write API built in, on top of the functionality for long-term-storage and downsampling. Since the OTEL Exporter natively implements the Prometheus Remote Write protocol, it can directly upload TSDB blocks to the object storage bucket of Thanos even without an underlying Prometheus.
Alumet was configured as following and deployed in the host of a single-node K8s cluster which had an OTEL collector using the operator and Thanos.
# Alumet config
[plugins.opentelemetry]
collector_host = "http://my-otel-collector-exposed-service"
prefix = ""
suffix = "_alumet"
append_unit_to_metric_name = true
use_unit_display_name = true
add_attributes_to_labels = true
push_interval_seconds = 15
# Otel values.yaml
# Top level field related to the OpenTelemetry Operator
opentelemetry-operator:
  # Field indicating whether the operator is enabled or not
  enabled: true
  manager:
    collectorImage:
      repository: otel/opentelemetry-collector-contrib
  # Sub-field for admission webhooks configuration
  admissionWebhooks:
    # Use Helm to automatically generate self-signed certificate.
    certManager:
      enabled: false
    autoGenerateCert:
      enabled: true
collectors:
  otelgateway:
    suffix: gateway
    replicas: 1
    mode: deployment
    enabled: true
    config:
      receivers:
        otlp:
          protocols:
            grpc:
              endpoint: 0.0.0.0:4317
      processors:
        batch:
          send_batch_size: 1024
          timeout: 1s
      exporters:
        prometheusremotewrite:
          endpoint: "http://my-thanos-receive-service.monitoring.svc.cluster.local:19291/api/v1/receive"

      service:
        pipelines:
          metrics:
            receivers:
              - otlp
            processors:
              - batch
            exporters:
              - prometheusremotewrite
With this setup, we can see the real-time measurements made by Alumet in Thanos: