Prometheus Exporter plugin
Prometheus is an open source system for monitoring and alerting based on the collection (pull-based) of metrics in a Time Series Data Base (TSDB).
The prometheus-exporter plugin is standard Prometheus exporter, which is exposed as a web service (with endpoint /metrics) to be reached by the Prometheus system to pull the Alumet’s metrics.
Requirements
For this plugin to work, you first need to deploy Prometheus. See some examples below.
Configuration
Here is an example of how to configure this plugin.
Put the following in the configuration file of the Alumet agent (usually alumet-config.toml).
[plugins.prometheus-exporter]
host = "0.0.0.0"
prefix = ""
suffix = "_alumet"
port = 9091
append_unit_to_metric_name = true
use_unit_display_name = true
add_attributes_to_labels = true
Examples
The plugin has been tested on both a local environment and a K8S cluster.
Testing Locally
The plugin can be tested in a local environment with the Alumet’s default configuration for it and results in the ability of downloading the metrics from http://localhost:9091/metrics.
Note that the list of metrics available will vary based on the input plugins used.
Show an excerpt of what the metrics endpoint returns
# HELP mem_total_kB_alumet ?.
# TYPE mem_total_kB_alumet gauge
mem_total_kB_alumet{resource_consumer_id="",resource_consumer_kind="local_machine",resource_id="",resource_kind="local_machine"} 12372303872.0
# HELP mem_free_kB_alumet ?.
# TYPE mem_free_kB_alumet gauge
mem_free_kB_alumet{resource_consumer_id="",resource_consumer_kind="local_machine",resource_id="",resource_kind="local_machine"} 1491062784.0
# HELP mem_available_kB_alumet ?.
# TYPE mem_available_kB_alumet gauge
mem_available_kB_alumet{resource_consumer_id="",resource_consumer_kind="local_machine",resource_id="",resource_kind="local_machine"} 5022056448.0
# HELP cached_kB_alumet ?.
# TYPE cached_kB_alumet gauge
cached_kB_alumet{resource_consumer_id="",resource_consumer_kind="local_machine",resource_id="",resource_kind="local_machine"} 3523051520.0
# HELP swap_cached_kB_alumet ?.
# TYPE swap_cached_kB_alumet gauge
swap_cached_kB_alumet{resource_consumer_id="",resource_consumer_kind="local_machine",resource_id="",resource_kind="local_machine"} 54939648.0
# HELP active_kB_alumet ?.
# TYPE active_kB_alumet gauge
active_kB_alumet{resource_consumer_id="",resource_consumer_kind="local_machine",resource_id="",resource_kind="local_machine"} 2447753216.0
# HELP inactive_kB_alumet ?.
# TYPE inactive_kB_alumet gauge
inactive_kB_alumet{resource_consumer_id="",resource_consumer_kind="local_machine",resource_id="",resource_kind="local_machine"} 7838990336.0
# HELP mapped_kB_alumet ?.
# TYPE mapped_kB_alumet gauge
mapped_kB_alumet{resource_consumer_id="",resource_consumer_kind="local_machine",resource_id="",resource_kind="local_machine"} 230359040.0
# HELP kernel_cpu_time_ms_alumet busy CPU time.
# TYPE kernel_cpu_time_ms_alumet gauge
kernel_cpu_time_ms_alumet{cpu_state="idle",resource_consumer_id="",resource_consumer_kind="local_machine",resource_id="11",resource_kind="cpu_core"} 4950.0
kernel_cpu_time_ms_alumet{cpu_state="steal",resource_consumer_id="",resource_consumer_kind="local_machine",resource_id="1",resource_kind="cpu_core"} 0.0
kernel_cpu_time_ms_alumet{cpu_state="idle",resource_consumer_id="",resource_consumer_kind="local_machine",resource_id="7",resource_kind="cpu_core"} 4900.0
[…]
# EOF
Running on K8S: Alumet + Prometheus + Grafana
For the K8s demo, Alumet was installed with the it’s default configuration in the host of a NUC where there was a single-node k3s cluster. After installing the default kube-prometheus-stack, the following manifest was deployed to scrape the exporter:
apiVersion: monitoring.coreos.com/v1alpha1
kind: ScrapeConfig
metadata:
  name: alumet-host-scrape
  labels:
    release: promstack
spec:
  staticConfigs:
    - labels:
        job: alumet-host
      targets:
        - my_host_ip:9091
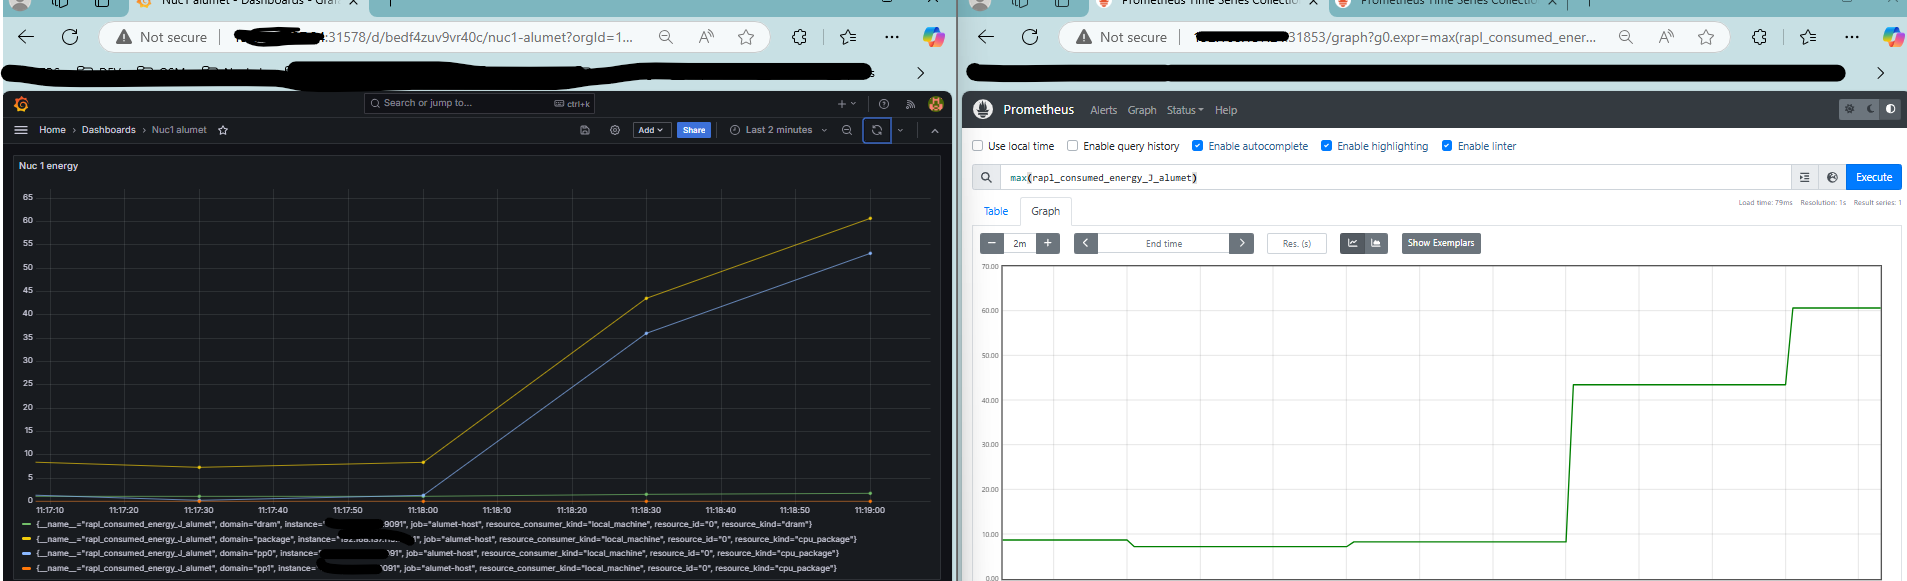
We used the stress command to simulate some load on a compute node:
stress --cpu 8 --io 4 --vm 2 --vm-bytes 128M
This resulted in Grafana and Prometheus to correctly capture the behavior of the system, as shown in the figure below.